Technical Analysis and Chart PatternsUnderstanding Technical Analysis
At its foundation, technical analysis relies on three key assumptions. First, the market discounts everything, meaning price reflects all known information. Second, prices move in trends—once a trend starts, it is more likely to continue than reverse immediately. Third, history tends to repeat itself, as market participants often react similarly to comparable situations due to human psychology such as fear, greed, and herd behavior.
Technical analysis uses tools like price charts, indicators, and oscillators to identify trends, momentum, volatility, and potential reversal points. Charts visually represent price movements over time, making them the backbone of technical analysis. Common chart types include line charts, bar charts, and candlestick charts, with candlesticks being the most popular due to their detailed representation of price action.
Role of Charts in Technical Analysis
Charts help traders understand how price behaves over different time frames. Short-term traders may focus on minute or hourly charts, while swing traders prefer daily charts, and long-term investors may analyze weekly or monthly charts. Regardless of the time frame, the principles of technical analysis remain the same.
Key elements observed on charts include support and resistance levels, trendlines, moving averages, and volume patterns. Support represents a price level where demand is strong enough to prevent further decline, while resistance is where selling pressure prevents further price increases. These levels often act as decision points for traders.
What Are Chart Patterns?
Chart patterns are specific formations created by price movements on a chart. They represent the collective psychology of market participants and often signal continuation or reversal of trends. Chart patterns do not guarantee outcomes, but they increase the probability of a particular move when combined with other technical tools.
Chart patterns are broadly classified into three categories:
Reversal Patterns
Continuation Patterns
Bilateral Patterns
Understanding these patterns allows traders to anticipate potential breakouts, breakdowns, or trend changes.
Reversal Chart Patterns
Reversal patterns indicate a possible change in the prevailing trend. They form after a sustained upward or downward move and suggest that momentum is weakening.
One of the most well-known reversal patterns is the Head and Shoulders pattern. It consists of three peaks: a higher middle peak (the head) flanked by two lower peaks (the shoulders). When price breaks below the neckline, it signals a potential reversal from an uptrend to a downtrend. The inverse head and shoulders pattern works similarly but indicates a reversal from a downtrend to an uptrend.
Another important reversal pattern is the Double Top and Double Bottom. A double top forms when price tests a resistance level twice and fails to break higher, signaling bearish reversal. A double bottom forms when price tests a support level twice and fails to break lower, signaling bullish reversal. These patterns reflect exhaustion of buyers or sellers at critical levels.
Continuation Chart Patterns
Continuation patterns suggest a temporary pause in the market before the prevailing trend resumes. They often occur during periods of consolidation, where the market gathers strength for the next move.
Flags and Pennants are common continuation patterns. Flags appear as small rectangular consolidations sloping against the prevailing trend, while pennants resemble small symmetrical triangles. Both patterns indicate strong momentum prior to consolidation and usually resolve in the direction of the original trend.
Triangles are another popular continuation pattern, including ascending, descending, and symmetrical triangles. An ascending triangle forms with a flat resistance line and rising support, signaling bullish continuation. A descending triangle has flat support and falling resistance, signaling bearish continuation. Symmetrical triangles show contracting price action and can break in either direction, often continuing the previous trend.
Bilateral Chart Patterns
Bilateral patterns indicate uncertainty in the market and can break in either direction. Traders usually wait for confirmation before taking a position.
The Symmetrical Triangle is a prime example of a bilateral pattern. It reflects a balance between buyers and sellers, with lower highs and higher lows converging toward an apex. A breakout above resistance suggests bullish continuation, while a breakdown below support suggests bearish continuation.
Importance of Volume in Chart Patterns
Volume plays a crucial role in validating chart patterns. A breakout or breakdown accompanied by high volume is considered more reliable than one with low volume. Volume confirms the strength of market participation behind a move. For example, in a head and shoulders pattern, increasing volume on the breakdown of the neckline strengthens the bearish signal.
Combining Chart Patterns with Indicators
While chart patterns are powerful, relying on them alone can be risky. Successful traders often combine chart patterns with technical indicators such as Relative Strength Index (RSI), Moving Average Convergence Divergence (MACD), and moving averages. These indicators help confirm momentum, trend strength, and overbought or oversold conditions.
For instance, a bullish breakout from a triangle pattern combined with RSI moving above 50 and price crossing above a moving average provides stronger confirmation. This multi-tool approach reduces false signals and improves decision-making.
Limitations of Technical Analysis and Chart Patterns
Despite their usefulness, technical analysis and chart patterns have limitations. Markets can behave unpredictably due to sudden news, economic events, or geopolitical factors. False breakouts are common, especially in low-volume or highly volatile markets. Additionally, chart patterns are subjective—different traders may interpret the same pattern differently.
Discipline, risk management, and proper position sizing are essential to handle these limitations. Stop-loss orders help protect capital when a pattern fails.
Conclusion
Technical analysis and chart patterns form the backbone of modern trading strategies. By studying price behavior, identifying recurring patterns, and understanding market psychology, traders can gain valuable insights into potential future movements. Chart patterns such as head and shoulders, double tops and bottoms, flags, and triangles help traders anticipate reversals and continuations with higher probability.
However, technical analysis is not a magic formula. Its true power lies in consistent practice, combining multiple tools, and disciplined risk management. When used correctly, technical analysis and chart patterns become a powerful framework for navigating financial markets and making informed, strategic trading decisions.
Community ideas

Unlock Trading SecretsUnderstanding Market Behavior
The first trading secret lies in understanding that markets move based on a combination of demand and supply, driven by human behavior. Prices do not move randomly; they react to information such as economic data, corporate earnings, geopolitical events, interest rate changes, and market sentiment. Traders who learn to read these influences gain an advantage. Technical analysis helps decode price action through charts, trends, support and resistance levels, and indicators. Fundamental analysis focuses on the intrinsic value of assets by studying financial statements, macroeconomic factors, and industry trends. Successful traders often combine both approaches instead of relying on only one.
The Power of Discipline and Consistency
One of the most overlooked trading secrets is discipline. Many traders fail not because their strategy is poor, but because they cannot follow it consistently. Discipline means sticking to predefined rules for entry, exit, position sizing, and risk management—regardless of emotions or market noise. Consistency in execution allows traders to measure performance accurately and improve over time. Without discipline, even the best strategy becomes ineffective.
Risk Management: The Core Secret
Risk management is the foundation of long-term trading success. Professional traders focus more on controlling losses than maximizing profits. A common rule is to never risk more than a small percentage of trading capital on a single trade. This ensures survival during losing streaks, which are inevitable in trading. Using stop-loss orders, maintaining a favorable risk-to-reward ratio, and avoiding overleveraging are critical practices. The secret here is simple but powerful: protect your capital first, and profits will follow.
Psychology and Emotional Control
Trading psychology is often described as the true battlefield. Fear, greed, hope, and revenge trading can sabotage even the most skilled traders. Fear may cause early exits, while greed may lead to overtrading or holding positions too long. Emotional control is developed through self-awareness, experience, and structured routines. Keeping a trading journal, reviewing mistakes, and accepting losses as part of the process help build mental resilience. Traders who master their emotions gain a significant edge over those who react impulsively.
Developing a Trading Strategy
Another key trading secret is having a clear, well-tested strategy. A strategy defines what to trade, when to trade, and how to trade. It may be based on trends, breakouts, reversals, momentum, or events such as earnings and economic announcements. The important factor is not the complexity of the strategy, but its clarity and repeatability. Backtesting strategies on historical data and forward-testing them in live or simulated markets builds confidence and reliability.
Timeframe and Trading Style Alignment
Not all trading styles suit every individual. Some traders thrive in fast-paced intraday trading, while others prefer swing trading or long-term investing. Understanding your personality, time availability, and risk tolerance is a crucial secret. A strategy that works well for one trader may fail for another simply due to differences in patience or decision-making speed. Aligning your trading style with your lifestyle increases the chances of consistency and long-term success.
Learning from Losses and Mistakes
Losses are unavoidable in trading, but they are also valuable teachers. The secret is not avoiding losses entirely, but learning from them. Each losing trade offers insight into strategy flaws, emotional mistakes, or market conditions. Traders who analyze losses objectively and make adjustments continuously improve. Those who ignore or emotionally react to losses often repeat the same mistakes.
The Role of Market Cycles
Markets move in cycles—bull markets, bear markets, and sideways phases. Recognizing the current phase is a powerful trading secret. Strategies that work well in trending markets may fail in range-bound conditions. Adapting to market cycles instead of forcing trades improves performance. Flexibility and awareness allow traders to shift strategies or reduce activity when conditions are unfavorable.
Patience and Long-Term Vision
Many beginners seek quick profits, but patience is a hidden trading secret. Sustainable success comes from compounding small, consistent gains over time. Professional traders think in terms of months and years, not days. They focus on process over outcome, knowing that results will naturally follow disciplined execution. Patience helps traders wait for high-probability setups instead of chasing every market move.
Continuous Learning and Adaptation
Markets evolve with technology, regulations, and global events. A trader who stops learning eventually falls behind. Continuous education—through books, courses, market analysis, and self-review—is essential. Staying adaptable and open to improvement is a major secret behind longevity in trading.
Conclusion
Unlocking trading secrets is not about finding a hidden indicator or insider tip. It is about mastering the fundamentals: understanding market behavior, managing risk, controlling emotions, following a disciplined strategy, and committing to continuous learning. Trading rewards those who respect the process and remain patient through challenges. When approached with the right mindset and structure, trading becomes less of a gamble and more of a professional skill—one that can deliver consistent results over the long term.

ABLBL: Falling Channel Study — Reversal Base + Swing Opportunity1️⃣ Primary Trend: Falling Channel (Bearish to Neutral)
Price has been moving inside a well-defined descending channel (lower highs & lower lows).
This indicates controlled selling, not panic — which is important for future reversals.
The stock is currently near the lower band of the channel, a typical area where:
Short covering starts
Value buyers enter
2️⃣ Support Zone & Reversal Signs
Strong demand zone: ₹114 – ₹118
Multiple rejections from this area
Long lower wicks indicate buying interest
This zone has acted as a base, increasing probability of a pullback move.
Breakout Levels to Watch (Very Important)
Immediate resistance: ₹133 – ₹134
Horizontal resistance + mid-channel zone
First sign of strength if crossed with volume
Major trend change confirmation: ₹150 – ₹152
Break & sustain above this = channel breakout
Can shift structure from downtrend → trend reversal
Swing Trading Perspective
Inside-channel swing opportunity:
Bounce from lower channel → mid / upper channel
Upside swing zones:
Target 1: ₹133–135
Target 2: ₹145
Target 3 (only if breakout): ₹150–155
🧠 What This Chart Is Saying (Simple Words)
Selling pressure is slowing down.
The stock is building a base near support.
A short swing bounce is likely first.
A trend reversal only happens above ₹150.
⚠️ Important Note
This analysis is for educational & learning purposes only.
Not a buy or sell recommendation.

Defining Option Chain TermsUnderlying Asset
The underlying asset is the financial instrument on which the option contract is based. It can be an equity share, stock index, commodity, currency, or exchange-traded fund (ETF). For example, in the NIFTY option chain, the underlying asset is the NIFTY 50 index. The price movement of the underlying asset directly influences the value of option contracts.
Strike Price
The strike price (or exercise price) is the predetermined price at which the option holder has the right to buy or sell the underlying asset. In a call option, it is the price at which the buyer can purchase the asset, while in a put option, it is the price at which the buyer can sell the asset. Option chains list multiple strike prices above and below the current market price, helping traders choose contracts based on their market outlook.
Expiry Date
The expiry date is the date on which the option contract ceases to exist. After this date, the option becomes invalid. Options can have weekly, monthly, or long-term expiries depending on the market. As expiry approaches, the time value of options decreases rapidly, a phenomenon known as time decay.
Call Option
A call option gives the buyer the right, but not the obligation, to buy the underlying asset at the strike price on or before the expiry date. Call options are generally purchased when traders expect the price of the underlying asset to rise. In the option chain, call options are typically displayed on the left side.
Put Option
A put option gives the buyer the right, but not the obligation, to sell the underlying asset at the strike price on or before expiry. Traders buy put options when they expect the price of the underlying asset to fall. Put options are usually displayed on the right side of the option chain.
Last Traded Price (LTP)
The last traded price is the most recent price at which a particular option contract was traded. It reflects the current market value of the option and is crucial for understanding real-time demand and supply.
Bid Price and Ask Price
The bid price is the highest price a buyer is willing to pay for an option contract, while the ask price is the lowest price a seller is willing to accept. The difference between these two prices is known as the bid-ask spread. A narrow spread indicates high liquidity, whereas a wide spread may signal low trading interest or higher risk.
Open Interest (OI)
Open interest represents the total number of outstanding option contracts that have not been settled or closed. It is one of the most closely watched indicators in an option chain. Rising open interest indicates the creation of new positions, while falling open interest suggests position unwinding. Traders often analyze open interest in combination with price movement to gauge market sentiment.
Change in Open Interest
Change in open interest shows the increase or decrease in the number of open contracts compared to the previous trading session. A sharp increase may indicate fresh buying or selling, while a decline suggests profit booking or exit from positions. It is widely used to identify support and resistance levels.
Volume
Volume refers to the total number of option contracts traded during a specific period, usually a trading day. High volume suggests strong market participation and interest in that particular strike price. Volume helps confirm price trends and breakout signals.
Implied Volatility (IV)
Implied volatility measures the market’s expectation of future price fluctuations in the underlying asset. Higher IV indicates expectations of significant price movement, often around events like earnings announcements or policy decisions. Lower IV suggests stable price expectations. IV plays a critical role in option pricing and strategy selection.
Intrinsic Value
Intrinsic value is the actual value of an option if it were exercised immediately. For a call option, it is the difference between the underlying price and the strike price, provided the underlying price is higher. For a put option, it is the difference when the strike price is higher than the underlying price. If an option has no intrinsic value, it is considered out-of-the-money.
Time Value
Time value is the portion of the option’s premium that exceeds its intrinsic value. It reflects the probability that the option may become profitable before expiry. Time value decreases as the option approaches expiry, a process known as theta decay.
In-the-Money (ITM), At-the-Money (ATM), and Out-of-the-Money (OTM)
An option is in-the-money when it has intrinsic value. It is at-the-money when the strike price is close to the current market price of the underlying asset. It is out-of-the-money when it has no intrinsic value. These classifications help traders choose options based on risk and reward preferences.
Option Premium
The option premium is the price paid by the buyer to the seller (writer) of the option. It consists of intrinsic value and time value. The premium is influenced by factors such as underlying price, volatility, time to expiry, and interest rates.
Greeks
Option Greeks measure how the price of an option responds to different factors. Delta shows sensitivity to price changes in the underlying asset, theta measures time decay, gamma measures delta changes, vega measures sensitivity to volatility, and rho measures sensitivity to interest rate changes. While not always directly visible in a basic option chain, Greeks are essential for advanced analysis.
Conclusion
Understanding option chain terms is fundamental to successful options trading. Each term—from strike price and expiry to open interest and implied volatility—provides valuable insights into market behavior and trader positioning. A well-analyzed option chain can reveal support and resistance levels, predict volatility, and help in selecting appropriate trading strategies. For anyone looking to participate in derivatives markets, mastering option chain terminology is not just beneficial but essential for informed and disciplined decision-making.

Understanding the Power of Volume in Financial MarketsWhat Is Volume in Trading?
Volume represents the total number of shares, contracts, or lots traded in a security or market during a specific period. In stocks, it is the number of shares exchanged; in futures and options, it is the number of contracts traded. Volume is typically displayed as vertical bars below price charts, giving traders a visual sense of market activity.
High volume indicates strong interest and participation from traders and investors, while low volume suggests weak interest or indecision. Importantly, volume does not predict direction on its own, but when combined with price action, it provides powerful confirmation.
Why Volume Is Important in Trading
Volume is often called the “heartbeat of the market” because it reflects real commitment behind price movements. Price can move up or down on low volume, but such moves are often unreliable and prone to failure. When price movement is accompanied by high volume, it shows conviction and increases the probability that the move will continue.
Key reasons volume is crucial:
Confirms trends – Strong trends are supported by rising volume.
Validates breakouts – Breakouts with high volume are more likely to succeed.
Signals reversals – Sudden volume spikes can indicate a change in trend.
Shows institutional activity – Large players usually leave volume footprints.
Volume and Trend Confirmation
One of the most common uses of volume is to confirm trends. In an uptrend, volume should generally increase during upward price movements and decrease during pullbacks. This pattern shows that buyers are aggressive and sellers are weak. Conversely, in a downtrend, volume tends to increase during price declines and decrease during rallies, confirming seller dominance.
If prices are rising but volume is falling, it creates a bearish divergence, warning that the uptrend may be losing strength. Similarly, falling prices on declining volume may indicate that selling pressure is weakening and a reversal could be near.
Trading Breakouts with Volume
Breakouts occur when price moves beyond a key support or resistance level. Many false breakouts happen in low-volume environments. Volume helps traders filter out these traps.
High-volume breakout: Indicates strong participation and higher chances of continuation.
Low-volume breakout: Often lacks conviction and may result in a pullback or false move.
Professional traders wait for volume expansion during a breakout to confirm that the market agrees with the price move.
Volume Spikes and Market Reversals
Sudden, unusually high volume—known as a volume spike—often appears near market tops or bottoms. These spikes may represent panic selling, aggressive buying, or institutional accumulation/distribution.
For example:
After a long downtrend, a sharp fall with extremely high volume followed by price stabilization may signal capitulation, often leading to a reversal.
Near market tops, high volume combined with slow price progress may suggest distribution, where smart money is selling to late buyers.
Understanding these volume clues helps traders anticipate turning points.
Popular Volume-Based Indicators
Traders often enhance raw volume analysis with technical indicators, such as:
Volume Moving Average: Smooths volume data to identify unusual activity.
On-Balance Volume (OBV): Measures cumulative buying and selling pressure.
Volume Weighted Average Price (VWAP): Shows the average price weighted by volume, widely used by institutions.
Accumulation/Distribution Line: Identifies whether money is flowing into or out of a stock.
These tools help traders align price action with underlying market participation.
Volume in Different Market Conditions
Volume behaves differently depending on market structure:
Trending markets: Volume expands in the direction of the trend.
Range-bound markets: Volume contracts as price oscillates between support and resistance.
News-driven markets: Volume spikes sharply due to sudden influx of orders.
Recognizing these patterns allows traders to adapt strategies to current conditions.
Volume and Risk Management
Trading with volume also improves risk management. Entering trades during high-volume periods ensures better liquidity, tighter spreads, and smoother execution. Low-volume trading environments increase the risk of slippage and erratic price movements.
Volume can also help traders decide when not to trade. If volume is significantly below average, it may be better to stay on the sidelines rather than force trades in uncertain conditions.
Common Mistakes When Using Volume
While volume is powerful, it must be used correctly. Common mistakes include:
Using volume alone without price context
Ignoring volume during key chart patterns
Misinterpreting low volume as always bearish or bullish
Overreacting to single volume spikes without confirmation
Successful traders combine volume with price action, support-resistance levels, and broader market context.
Conclusion
Trading with volume adds depth, clarity, and confidence to market analysis. Volume reveals the strength behind price movements, exposes institutional activity, and helps traders avoid false signals. Whether confirming trends, validating breakouts, or spotting reversals, volume acts as a crucial companion to price action.
In essence, price tells you where the market is going, but volume tells you whether it is worth following. Traders who learn to read volume effectively gain a significant edge, improving both accuracy and consistency in their trading decisions.

Derivatives Explained: Meaning, Types, Uses, and Its ImpactsWhat Are Derivatives?
A derivative is a financial contract between two or more parties that derives its value from the price movement of an underlying asset. The contract itself has no independent value; instead, its worth depends entirely on how the underlying asset performs in the market. For example, a futures contract on crude oil depends on the future price of crude oil, while an options contract on a stock depends on that stock’s price movement.
Derivatives are typically used for three main purposes: hedging risk, speculation, and arbitrage. While they are powerful tools, they can also amplify losses if used without proper understanding or risk management.
Types of Derivatives
There are four major types of derivatives commonly traded in financial markets:
Futures Contracts
Futures are standardized contracts traded on exchanges where two parties agree to buy or sell an underlying asset at a predetermined price on a specific future date. These contracts are legally binding and require margin payments. Futures are widely used in commodities, stock indices, currencies, and interest rates. For example, a farmer may use futures to lock in a price for crops, protecting against price fluctuations.
Forward Contracts
Forwards are similar to futures but are privately negotiated (over-the-counter) contracts rather than exchange-traded. They are customized according to the needs of the parties involved. However, forwards carry higher counterparty risk because they are not regulated or guaranteed by an exchange.
Options Contracts
Options give the buyer the right, but not the obligation, to buy or sell an underlying asset at a specific price within a certain time period. A call option gives the right to buy, while a put option gives the right to sell. Options are widely used for hedging and strategic trading due to their flexibility and limited risk for buyers.
Swaps
Swaps are agreements between two parties to exchange cash flows or financial obligations. The most common types are interest rate swaps and currency swaps. These instruments are mainly used by large institutions to manage interest rate or currency risk.
Role of Derivatives in Risk Management
One of the primary purposes of derivatives is hedging. Hedging involves reducing or eliminating the risk of adverse price movements. For instance, an airline company may use fuel futures to lock in fuel prices and protect itself from rising oil costs. Similarly, exporters and importers use currency derivatives to hedge against exchange rate volatility.
By allowing market participants to transfer risk to those willing to bear it, derivatives contribute to financial stability when used responsibly. They help businesses plan future costs and revenues with greater certainty.
Derivatives as a Tool for Speculation
Speculators use derivatives to profit from expected price movements in underlying assets. Because derivatives often require a relatively small initial investment (margin or premium), they offer high leverage. This means that even small price changes can result in significant profits—or losses.
Speculation adds liquidity to markets, making it easier for hedgers to enter and exit positions. However, excessive speculation without proper risk control can lead to sharp market volatility and financial instability.
Arbitrage and Market Efficiency
Arbitrage involves taking advantage of price differences in different markets to earn risk-free profits. Derivatives enable arbitrage by linking prices across markets and time periods. For example, if a futures price deviates significantly from the spot price, arbitrageurs step in to exploit the difference, helping bring prices back into alignment.
This process improves price discovery and overall market efficiency. As a result, derivatives markets often reflect expectations about future prices, interest rates, and economic conditions.
Advantages of Derivatives
Derivatives offer several benefits to financial markets:
Risk Management: Effective tools for hedging price, interest rate, and currency risks.
Leverage: Allows traders to control large positions with limited capital.
Liquidity: High trading volumes improve market depth and efficiency.
Price Discovery: Futures and options markets provide insights into future price expectations.
Risks Associated with Derivatives
Despite their advantages, derivatives carry significant risks:
Leverage Risk: Small market movements can lead to large losses.
Counterparty Risk: Especially in over-the-counter derivatives like forwards and swaps.
Complexity: Misunderstanding contract terms can result in unexpected outcomes.
Systemic Risk: Excessive or poorly regulated use of derivatives can threaten financial stability, as seen during the 2008 global financial crisis.
Derivatives in the Indian Financial Market
In India, derivatives trading is well-established and regulated by the Securities and Exchange Board of India (SEBI). The National Stock Exchange (NSE) and Bombay Stock Exchange (BSE) offer a wide range of derivative products, including index futures, stock options, and currency derivatives. These instruments have significantly increased market participation, liquidity, and transparency in the Indian financial system.
Conclusion
Derivatives are indispensable instruments in today’s global financial markets. When used correctly, they help manage risk, improve market efficiency, and support economic growth. However, their complexity and leverage require a deep understanding and disciplined risk management. For traders and investors, derivatives should not be seen merely as tools for quick profits, but as strategic instruments that demand knowledge, planning, and responsibility. In essence, derivatives are neither inherently good nor bad—their impact depends on how wisely they are used.

Market Reform FalloutUnderstanding the Ripple Effects on the Economy and Investors:
Market reforms are often introduced with the intention of improving efficiency, transparency, and long-term economic growth. Governments and regulators implement reforms to correct structural weaknesses, modernize outdated systems, attract investment, and align domestic markets with global standards. However, while the long-term objectives of market reforms are usually positive, their immediate and medium-term consequences—commonly referred to as * market reform fallout—can be complex, disruptive, and unevenly distributed across sectors and stakeholders. Understanding this fallout is critical for policymakers, businesses, investors, and traders who must navigate periods of uncertainty and transition.
Short-Term Volatility and Market Uncertainty
One of the most visible consequences of market reforms is short-term volatility. Any major change in regulations, taxation, trade policy, labor laws, or financial market structure introduces uncertainty. Markets are driven not only by fundamentals but also by expectations. When reforms are announced, participants reassess risks, profitability, and future cash flows. This reassessment often leads to sharp price movements, increased volatility, and temporary dislocations in asset prices.
For example, reforms aimed at tightening financial regulations may initially hurt banking and financial stocks due to higher compliance costs or reduced leverage. Similarly, subsidy removal or tax reforms can negatively impact sectors that previously relied on government support. In the short run, this volatility can shake investor confidence, reduce liquidity, and trigger risk-off behavior, especially among foreign institutional investors who are sensitive to policy stability.
Sectoral Winners and Losers
Market reform fallout rarely affects all sectors equally. Reforms tend to create clear winners and losers. Industries that benefit from deregulation, privatization, or increased competition often see long-term gains, while those facing stricter rules, reduced protection, or higher costs may struggle.
For instance, labor market reforms may improve productivity and competitiveness over time but can initially create unrest in labor-intensive industries. Trade liberalization can boost export-oriented sectors while exposing domestic industries to intense global competition. Energy or environmental reforms may hurt traditional fossil-fuel-based businesses while accelerating growth in renewable energy and green technology sectors. This uneven impact often leads to capital rotation across sectors, as investors reallocate funds toward perceived beneficiaries of reform.
Impact on Businesses and Corporate Strategy
From a corporate perspective, market reforms force businesses to adapt their strategies. Companies may need to restructure operations, invest in new technologies, alter supply chains, or revise pricing models. While large corporations with strong balance sheets can absorb these changes, small and medium enterprises (SMEs) often face greater stress due to limited resources.
Compliance costs, changes in licensing norms, or new reporting requirements can increase operational expenses in the short term. Some firms may experience margin pressure or declining profitability before they can adjust. However, reforms can also push businesses toward greater efficiency, innovation, and global competitiveness. Over time, companies that successfully adapt often emerge stronger, while inefficient players exit the market, leading to consolidation.
Investor Sentiment and Capital Flows
Investor reaction plays a central role in shaping the fallout of market reforms. Domestic investors may initially adopt a cautious stance, waiting for clarity on implementation and outcomes. Foreign investors, in particular, closely monitor reform credibility, political stability, and consistency of policy execution. Sudden or poorly communicated reforms can trigger capital outflows, currency depreciation, and pressure on financial markets.
On the other hand, credible and well-structured reforms can attract long-term capital. While short-term investors may exit due to volatility, long-term institutional investors often view reforms as a signal of commitment to economic modernization. This divergence in investor behavior explains why markets sometimes fall sharply immediately after reform announcements but recover strongly once confidence is restored.
Social and Employment Implications
Beyond markets and balance sheets, reform fallout has significant social dimensions. Changes in labor laws, privatization of public sector enterprises, or reduction in subsidies can lead to job losses or wage pressures in the short term. These outcomes may spark public opposition, protests, or political pushback, which in turn adds another layer of uncertainty to markets.
However, if reforms succeed in boosting productivity, attracting investment, and fostering entrepreneurship, they can generate employment opportunities over the long run. The challenge lies in managing the transition—providing safety nets, reskilling programs, and clear communication to minimize social disruption while maintaining reform momentum.
Policy Execution and Credibility Risks
The severity of market reform fallout largely depends on how reforms are implemented. Gradual, well-communicated reforms with clear timelines tend to reduce shock and allow markets to adjust smoothly. In contrast, abrupt changes without adequate consultation or clarity can amplify negative reactions.
Policy credibility is equally important. If investors believe reforms may be rolled back due to political pressure or lack of consensus, uncertainty persists, prolonging market instability. Consistent execution, transparency, and alignment between fiscal, monetary, and regulatory policies help contain fallout and accelerate recovery.
Long-Term Structural Benefits
Despite short-term pain, market reforms are often essential for long-term economic health. They can improve resource allocation, enhance productivity, reduce inefficiencies, and increase global competitiveness. Over time, markets typically reward economies that undertake difficult but necessary reforms.
For investors and traders, understanding reform-driven cycles is crucial. Periods of reform fallout can present opportunities to accumulate quality assets at attractive valuations. Long-term investors who focus on fundamentals rather than short-term noise often benefit as reforms translate into sustainable growth.
Conclusion
Market reform fallout is an inevitable part of economic transformation. While reforms aim to strengthen markets and economies, their immediate consequences often include volatility, uncertainty, and uneven sectoral impact. Short-term disruptions can test investor confidence, corporate resilience, and social stability. However, when reforms are well-designed, credibly implemented, and supported by complementary policies, the long-term benefits tend to outweigh the initial costs.
For market participants, the key lies in understanding the nature of reforms, identifying structural winners and losers, and maintaining a balanced perspective. Rather than viewing reform fallout purely as a risk, it can be seen as a phase of adjustment—one that reshapes markets, creates new opportunities, and lays the foundation for more robust and efficient economic systems in the future.
NaturalGas ShortGo with short as Natural Gas conditions are not favor to it. Check the entry and exit point for the NatGas.
It's just our analysis we're not responsible for your losses or gains. you must do strong analysis.

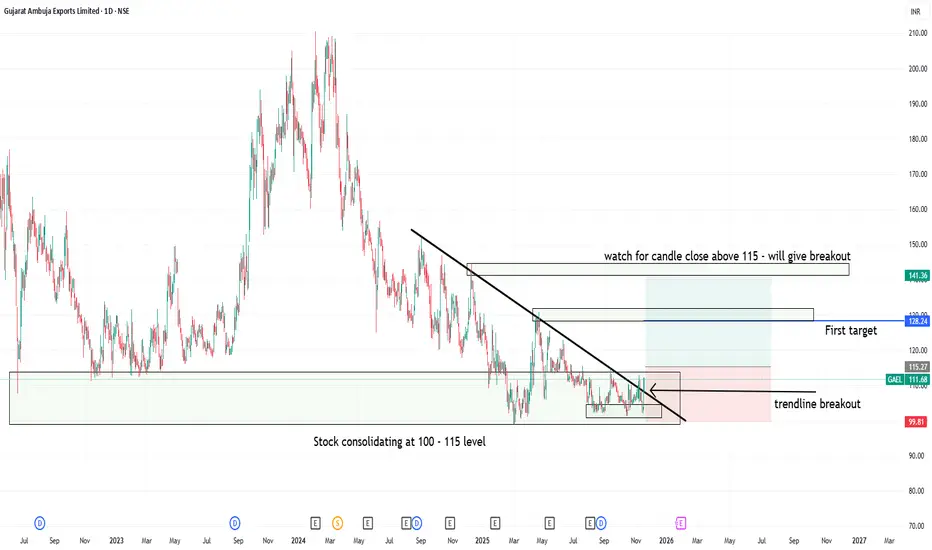
Trendline breakout at support level in GAEL1. Gujrat ambuja export lt- showing consolidation at 100 to 115 levels
2. Candle close above 115 can trigger consolidation breakout at strong support zone
3. Trendline breakout has already happend but above 115 close will be safe and logical
4. Good Risk:Reward one can watch for upside movement with strict sl level
Nifty4 hrs. candle chart consolidation after steep fall from all time high levels near November 2025 lows from were market produce momentum for rally towards all time high .now trading near downtrend line resistance area from all time high correction if this 4 hrs. candle manages to close strong above downtrend line resistance line probability of nifty moving back towards 26200 to 26500 levels are becoming high . bullish view fails if nifty start a 4 hour candle close below recent lows 25500 approx.( also depends on Mr. Trump does not create any uncertainties and let market run smoothly )

Bank of baroda short trade.Short Trade Setup – Bank of Baroda (NSE: BANKBARODA)
Bank of Baroda recently hit an all-time high near ₹311–312 levels but has shown early signs of exhaustion and profit booking. The stock is now trading around the ₹302–308 zone after pulling back from its peak, with some sessions showing rejection at higher levels and increased selling pressure (especially visible in recent intraday lows near ₹298–300).
Trade Structure (Bearish View):
Entry: Around ₹302 (ideal on confirmation of weakness / breakdown from current consolidation or on a retest of ₹302–305 zone
Stop Loss: ₹312.50 (placed above the recent swing high / psychological & recent peak level near ₹311–312 to invalidate the bearish thesis if bulls regain strong momentum)
Target: ₹280.70 (first major target offering ~7–8% downside potential from entry, aligning with potential support zones

Buying idea in PNBPNB is going to break almost Oct 2010 trendline in Monthly chart which is almost 16 years. RSI on D+W+M is above 60 which indicating that the momentum is also in favour. Moreover the PSU bank sector is also very strong. If we see the chart from 2017 to till date, it is like a cup and handle pattern. The stock has crossed its 200 DMA on monthly chart and sustained above it.

GIFTNIFTY IntraSwing Levels for 16th JAN 2026GIFTNIFTY IntraSwing Levels For 16th JAN 2026
🚀Follow & Compare NIFTY spot Post for Taking Trade
💥Level Interpretation / description:
L#1: If the candle crossed & stays above the “Buy Gen”, it is treated / considered as Bullish bias.
L#2: Possibility / Probability of REVERSAL near RLB#1 & UBTgt
L#3: If the candle stays above “Sell Gen” but below “Buy Gen”, it is treated / considered as Sidewise. Aggressive Traders can take Long position near “Sell Gen” either retesting or crossed from Below & vice-versa i.e. can take Short position near “Buy Gen” either retesting or crossed downward from Above.
L#4: If the candle crossed & stays below the “Sell Gen”, it is treated / considered a Bearish bias.
L#5: Possibility / Probability of REVERSAL near RLS#1 & USTgt
HZB (Buy side) & HZS (Sell side) => Hurdle Zone,
*** Specialty of “HZB#1, HZB#2 HZS#1 & HZS#2” is Sidewise (behaviour in Nature)
Rest Plotted and Mentioned on Chart
Color code Used:
Green =. Positive bias.
Red =. Negative bias.
RED in Between Green means Trend Finder / Momentum Change
/ CYCLE Change and Vice Versa.
Notice One thing: HOW LEVELS are Working.
Use any Momentum Indicator / Oscillator or as you "USED to" to Take entry.
━━━━━━━━━━━━━━━━━━━━━━━━━━━━━━━━━━━━━━━━━━━
⚠️ DISCLAIMER:
The information, views, and ideas shared here are purely for educational and informational purposes only. They are not intended as investment advice or a recommendation to buy, sell, or hold any financial instruments. I am not a SEBI-registered financial adviser.
Trading and investing in the stock market involves risk, and you should do your own research and analysis. You are solely responsible for any decisions made based on this research.
"As HARD EARNED MONEY IS YOUR's, So DECISION SHOULD HAVE TO BE YOUR's".
━━━━━━━━━━━━━━━━━━━━━━━━━━━━━━━━━
❇️ Follow notification about periodical View
💥 Do Comment for Stock WEEKLY Level Analysis.🚀
📊 Do you agree with this view?
✈️ HIT THE PLANE ICON if this technical observation resonates with you. It will Motivate me.

Understanding the Cup & Handle Pattern in 360 One Wam Limited🔍 Introduction
360 One Wam Limited is currently trading around ₹1230.00 on its weekly chart. The stock has recently completed the edge of a Cup & Handle pattern, a classic bullish continuation formation. Traders and investors often view this as a powerful signal of potential upside momentum once the neckline is crossed. Let’s break down what this pattern means, why it matters on a weekly chart, and how to approach it with proper risk management.
☕ What is the Cup & Handle Pattern?
Cup Formation:
The “cup” resembles a rounded bottom, showing a period of consolidation after a prior uptrend.
It reflects a gradual shift from selling pressure to accumulation.
Handle Formation:
The “handle” is a smaller consolidation or pullback that occurs after the cup.
It typically slopes downward slightly, shaking out weak hands before the breakout.
Neckline Breakout:
The neckline is the resistance level formed at the top of the cup.
A breakout above this neckline signals renewed bullish strength and often leads to a strong upward move.
📊 Importance of the Weekly Chart
Long-Term Reliability: Patterns on weekly charts carry more weight than daily charts because they represent broader investor sentiment.
Reduced Noise: Weekly candles filter out short-term volatility, making the breakout more meaningful.
Institutional Interest: Larger players often act on weekly chart signals, adding credibility to the move.
🎯 Proper Entry Strategy
Entry Point:
The ideal entry is on a confirmed breakout above the neckline with strong volume.
Traders should wait for a weekly close above the neckline to avoid false breakouts.
Confirmation Tools:
Volume expansion during breakout.
Momentum indicators (RSI crossing above 60, MACD bullish crossover).
⚖️ Risk Management Criteria
Stop Loss Placement:
Place stop loss just below the handle’s low or slightly under the neckline after breakout.
This limits downside risk if the breakout fails.
Position Sizing:
Risk only a small percentage of capital (1–2%) per trade.
Adjust position size based on volatility and stop-loss distance.
Target Projection:
Measure the depth of the cup and project it upward from the neckline to estimate potential upside.
Example: If the cup depth is ₹200, breakout target could be ₹1410 (₹1210 + ₹200).
📌 Key Takeaways for Traders & Investors
The Cup & Handle is a bullish continuation pattern, signaling strength after consolidation.
Weekly chart patterns are more reliable than daily ones, reducing noise and false signals.
Entry should be on neckline breakout with volume confirmation.
Risk management is critical: use stop losses and proper position sizing.
Potential upside can be projected by measuring the cup’s depth, but patience is key—weekly breakouts take time to unfold.
📝 Final Thoughts
For 360 One Wam Limited, the completion of the Cup & Handle pattern around ₹1210 sets the stage for a potential bullish rally once the neckline is crossed. Traders should remain disciplined, waiting for confirmation and managing risk carefully. Investors can view this as a sign of long-term strength, but must align entries with their risk tolerance and investment horizon.

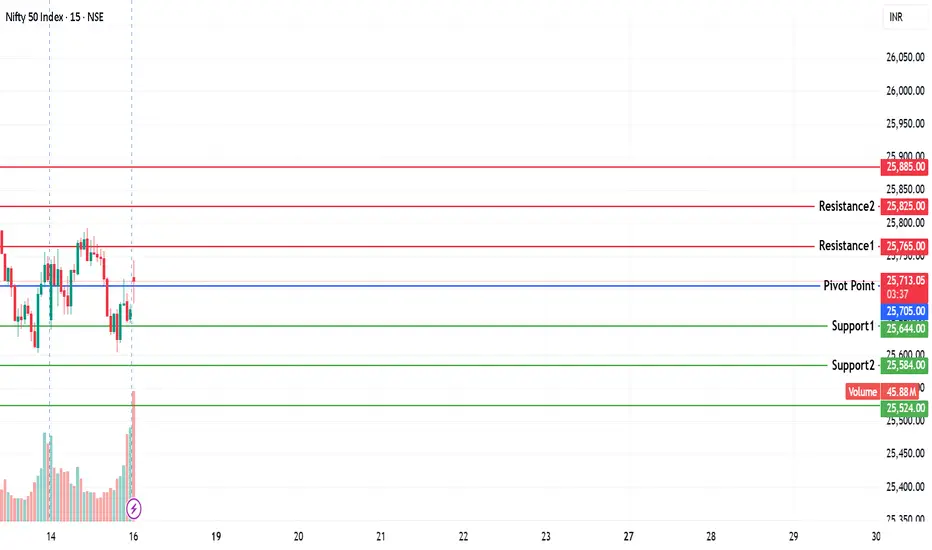
NIFTY KEY LEVELS FOR 16.01.2026NIFTY KEY LEVELS FOR 16.01.2026
Timeframe: 3 Minutes
If the candle stays above the pivot point, it is considered a bullish bias; if it remains below, it indicates a bearish bias. Price may reverse near Resistance 1 or Support 1. If it moves further, the next potential reversal zone is near Resistance 2 or Support 2. If these levels are also broken, we can expect the trend.
When a support or resistance level is broken, it often reverses its role; a broken resistance becomes the new support, and a broken support becomes the new resistance.
If the range(R2-S2) is narrow, the market may become volatile or trend strongly. If the range is wide, the market is more likely to remain sideways
please like and share my idea if you find it helpful
📢 Disclaimer
I am not a SEBI-registered financial adviser.
The information, views, and ideas shared here are purely for educational and informational purposes only. They are not intended as investment advice or a recommendation to buy, sell, or hold any financial instruments.
Please consult with your SEBI-registered financial advisor before making any trading or investment decisions.
Trading and investing in the stock market involves risk, and you should do your own research and analysis. You are solely responsible for any decisions made based on this research.
NIFTY Sell on Rise | Options Trade with Defined RiskNIFTY continues to respect the upper trendline resistance, indicating a bearish bias in the near term. Price action suggests a sell-on-rise opportunity as long as the index trades below this resistance zone.
📉 Index View (Spot):
Resistance Zone: 25,750
Downside Targets: 25,650 – 25,600
Rejection from this zone could trigger another leg lower toward the mentioned targets.
📌 Trade Setup (Options Strategy)
Instrument: NIFTY 25,800 CE (20th Jan Expiry)
Buy Zone: ₹125 – ₹115
Target: ₹190
Invalidation / Risk: ₹95 (closing basis)
💡 Trade Logic:
As long as ₹125 holds, momentum remains favorable for an upside move in the option premium. A pullback into the buy zone may offer a low-risk, high-reward setup, aligned with volatility expansion near resistance.
⚠️ Risk Management is Key
Use strict stop-loss discipline
Adjust position size according to your risk appetite
Avoid overtrading in volatile conditions
📌 Disclaimer
This analysis is strictly for educational purposes and not financial advice. Please consult your financial advisor and follow your own trading plan before taking any trades.
If you find this idea useful, hit the like button and share your views—your feedback helps us create better trading insights for the community.
🚀 Trade smart. Trade disciplined.
Happy Trading,
– The InvestPro Team

SBI Life: Double Top Signals Short-Term Downside RiskSBI Life Insurance is showing signs of a short-term trend reversal after forming a well-defined double top near the ₹2,105–2,110 zone on the hourly chart. The stock has slipped below its neckline support around ₹2,065, confirming bearish structure and indicating distribution at higher levels.
Momentum indicators reinforce the downside bias, with the RSI trending near 39 and MACD remaining in negative territory, suggesting selling pressure is still dominant. As long as prices remain below ₹2,085–2,100, the stock is vulnerable to further downside toward ₹2,040, followed by ₹2,020 and 2,000.

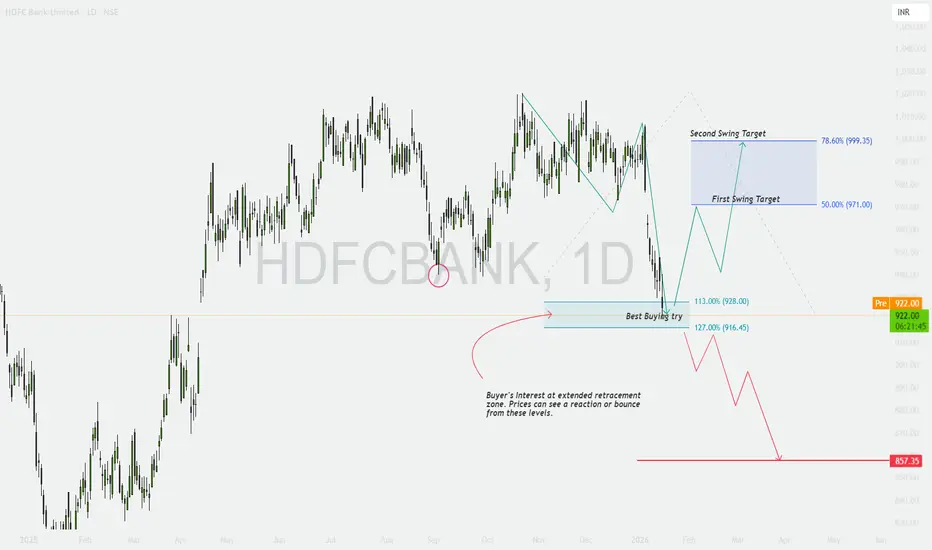
HDFCBANK - Extended Retracement Phase
📊 HDFC Bank – Daily Chart Update | Extended Retracement Phase
Timeframe: 1D
Trend Context: Medium-term correction within a broader structure
Current Price: ~₹925
🔍 What Changed from Previous Analysis? (Important Update)
Earlier, we discussed an ABC correction nearing completion around the ₹960–965 zone.
📉 Price failed to hold that zone, leading to a deeper, extended retracement.
Now the structure has evolved into an extended Fibonacci retracement, where buyers may re-emerge, but with higher risk.
📐 Fibonacci-Based Structure (Educational)
From the prior swing low → swing high:
113% Retracement: ~₹928
127% Retracement: ~₹916
➡️ This ₹916–928 zone is now marked as a “Best Buying Try” area, not blind buying.
📘 Extended retracements often invite short-covering + value buying, but confirmation is mandatory.
📌 Key Levels to Watch (Updated)
🟢 Support / Demand Zones
Primary Demand: ₹916–928
Major Breakdown Level: ₹857
🔴 Resistance / Recovery Zones
First Swing Target: ₹971 (50% retracement)
Second Swing Target: ₹999 (78.6% retracement)
Major Supply: ₹1,018–1,020
🟢 Bullish Scenario (Conditional Recovery)
If price:
Holds ₹916–928
Forms a base / reversal structure (daily close improvement, higher low)
Then:
First bounce toward ₹960–971
Sustained strength can extend toward ₹995–1,000
📈 This would be a relief rally, not trend reversal yet.
🔴 Bearish Scenario (Risk Case)
If price:
Breaks below ₹916 with daily close
Then:
Extended correction likely
Downside opens toward ₹880 → ₹857
📉 Below ₹916, buyers lose positional control.
🎓 Educational Insights
Extended retracements = high reward but high patience trades
Buying zones ≠ buying signals
Daily timeframe requires confirmation, not anticipation
Strong trends correct deeper before resuming
🧠 Options Trading View (Educational Only)
🟢 Near ₹916–928 (Only After Confirmation)
Bull Call Spread (ATM + OTM)
Put Credit Spread for range-bound recovery
🔴 If ₹916 Breaks
Bear Put Spread
Call Credit Spread near ₹960–980
⚠️ Avoid naked option selling in falling markets.
✅ DOs
✔ Wait for daily confirmation
✔ Trade zones, not emotions
✔ Use defined risk strategies
✔ Reduce position size during deep corrections
❌ DON’Ts
❌ Don’t average blindly
❌ Don’t assume every dip is the bottom
❌ Don’t ignore Fibonacci extensions
❌ Don’t overtrade volatility
🧾 Conclusion
HDFC Bank is now in an extended corrective phase.
The ₹916–928 zone is a potential demand area, but only confirmation will decide whether this becomes a base or a breakdown.
📌 Patience here is more profitable than prediction.
⚠️ Disclaimer
This analysis is for educational purposes only. I am not a SEBI registered analyst. Markets are risky, and I may be wrong. Please consult your financial advisor before trading.
ETH/USD 1H: Double Top Formation Under WatchEthereum is showing a classic 'M' pattern on the hourly chart. If the support level breaks, we could see a significant move lower. Watching the price action for confirmation

Nifty Trading Strategy for 16th January 2026📊 NIFTY 15-Minute Intraday Trade Setup
🔼 BUY SETUP
📌 Condition:
➡️ Buy only if NIFTY breaks and CLOSES above 25718 on a 15-minute candle
🎯 Buy Targets:
🥅 Target 1: 25735
🥅 Target 2: 25769
🥅 Target 3: 25800
🛑 Risk Management:
Use strict 15-min candle-based stop loss
Trail SL after Target 1 is achieved
🔽 SELL SETUP
📌 Condition:
➡️ Sell only if NIFTY breaks and CLOSES below 25581 on a 15-minute candle
🎯 Sell Targets:
🥅 Target 1: 25550
🥅 Target 2: 25525
🥅 Target 3: 25490
🛑 Risk Management:
Maintain strict stop loss
Trail SL after Target 1
⚠️ Important Trading Rules
✔️ Trade only after candle close
✔️ Avoid over-trading
✔️ Follow proper position sizing
✔️ Market volatility can change levels quickly
📢 DISCLAIMER
🚨 This is for educational purposes only
🚨 I am NOT a SEBI Registered Advisor
🚨 Stock market investments are subject to market risk
🚨 Please consult your financial advisor before trading
🚨 I am not responsible for any profit or loss

NIFTY Support-Turned-Resistance: The Retest PhaseThe Break & Retest
Think of a Trendline like a floor that the price has been bouncing on for a long time.
The Break: The price finally crashes through that floor. This tells us the sellers are now stronger than the buyers.
The Pullback: The price then drifts back up to touch that same line from underneath.
The Retest: This is the moment of truth. If the price hits the line and starts dropping again, it proves that the old floor has now become a solid ceiling (Resistance).
Why it matters
Traders love this because it's like a "second chance" to enter a trade. Instead of chasing the price when it first breaks, you wait for it to come back to you, which is much safer.

NIFTY Levels for Today
Here are the NIFTY's Levels for intraday (in the image below) today. Based on market movement, these levels can act as support, resistance or both.
Please consider these levels only if there is movement in index and 15m candle sustains at the given levels. The SL (Stop loss) for each BUY trade should be the previous RED candle below the given level. Similarly, the SL (Stop loss) for each SELL trade should be the previous GREEN candle above the given level.
Note: This idea and these levels are only for learning and educational purpose.
Your likes and boosts gives us motivation for continued learning and support.

BANKNIFTY Levels for Today
Here are the BANKNIFTY’s Levels for intraday (in the image below) today. Based on market movement, these levels can act as support, resistance or both.
Please consider these levels only if there is movement in index and 15m candle sustains at the given levels. The SL (Stop loss) for each BUY trade should be the previous RED candle below the given level. Similarly, the SL (Stop loss) for each SELL trade should be the previous GREEN candle above the given level.
Note: This idea and these levels are only for learning and educational purpose.
Your likes and boosts gives us motivation for continued learning and support.
