Bank of India Buy @ 163As per multiyear break out on weekly chart
+
Fibonacci
Buy = 163
TP 1 = 258
TP 2 = 296
TP 3 = 320 or Fib level of 2.618
TP 4 = 402
Very Long-term target = 1108
Community ideas

Bitcoin Bybit chart analysis JENUARY 16Hello
It's a Bitcoin Guide.
If you "follow"
You can receive real-time movement paths and comment notifications on major sections.
If my analysis was helpful,
Please click the booster button at the bottom.
This is Bitcoin's 30-minute chart.
There are no separate indicators released today.
Currently, the 6-hour MACD is forming a dead cross.
I've kept it as simple as possible.
*Long position strategy before and after the purple finger touches the top line
1. After the purple finger touches the first line (autonomous short)
-> Red finger: $95,235.6, long position entry point
/ Stop-loss price if the purple support line is broken
2. $97,512.1, long position first target
-> Target price from the top to 104.7K, sequentially over the weekend
If the top fails to touch the first line and immediately falls,
final hold on the long position at the second line (No.2) / Stop-loss price if the purple support line is broken
From the purple support line break,
Bottom -> Open to $93,555.6. If it falls to this level, the medium-term pattern will be broken again, so it may take a long time to rise.
*The price must not move sideways until the weekend,
and must not fall to the bottom.
It will hit 104.7K strongly and may see new highs starting next week.
Please use my analysis to this point for reference only.
I hope you operate safely, with principled trading and stop-loss orders essential.
Thank you.

XAUUSD (Gold) 45-Minute Chart – Bullish Trend Holding with MomenTrend & Structure:
Gold remains above the ascending trendline, confirming a valid short-term bullish trend. The recent candles show sideways consolidation after a strong impulsive rise, which typically favors continuation as long as support holds.
Price Action:
The market is forming higher lows while compressing below recent highs. This price behavior suggests indecision, not rejection—buyers are still defending dips.
RSI (14):
RSI is around 57–58, holding above the 50 level. This indicates bullish momentum, though momentum has stabilized rather than accelerated, consistent with consolidation.
Awesome Oscillator (AO):
AO bars remain above zero but decreasing, signaling that bullish momentum is cooling, not reversing. A fresh green expansion would confirm continuation.
MACD:
MACD histogram is slightly negative and contracting, while lines are flattening. This supports a pause within trend, not a confirmed bearish crossover.
Key Levels:
Immediate Support: Rising trendline / recent higher-low zone
Resistance: Consolidation highs near the recent swing top
Trend Failure: Strong close below the trendline

Nifty Intraday Analysis for 19th January 2026NSE:NIFTY
Index has resistance near 25850 – 25900 range and if index crosses and sustains above this level then may reach near 26075 – 26125 range.
Nifty has immediate support near 25550 – 25500 range and if this support is broken then index may tank near 25325 – 25275 range.
The market is expected to react to the fresh US tariff war with European countries on the Greenland issue. Upside momentum is limited in this scenario. Short term uptrend will be confirmed if the index closes above 25950 - 26000 zone.

Banknifty Intraday Analysis for 19th January 2026NSE:BANKNIFTY
Index has resistance near 60500 – 60600 range and if index crosses and sustains above this level then may reach near 61000 – 61100 range.
Banknifty has immediate support near 59700 - 59600 range and if this support is broken then index may tank near 59200 - 59100 range.
The market is expected to react to the fresh US tariff war with European countries on the Greenland issue. Uptrend momentum to continue if the index crosses and sustains above 60300 - 60400 zone.

Finnifty Intraday Analysis for 19th January 2026 NSE:CNXFINANCE
Index has resistance near 27775 - 27800 range and if index crosses and sustains above this level then may reach near 28050 - 28100 range.
Finnifty has immediate support near 27325 – 27275 range and if this support is broken then index may tank near 27050 – 27000 range.
The market is expected to react to the fresh US tariff war with European countries on the Greenland issue. Short term uptrend will be confirmed if the index closes above 27800 - 27900 zone.

Fedral Bank Buy @ 279 and 184As per multiyear break out on weekly chart
+
Fibonacci
Risky Buy = 279
Buy = 184
TP 1 = 314
TP 2 = 368 or Fib level of 3.618
TP 3 = 406
Very Long-term target = 590

Midnifty Intraday Analysis for 19th January 2026NSE:NIFTY_MID_SELECT
Index has immediate resistance near 13825 – 13850 range and if index crosses and sustains above this level then may reach 13975 – 14000 range.
Midnifty has immediate support near 13575 – 13550 range and if this support is broken then index may tank near 13425 – 13400 range.
The market is expected to react to the fresh US tariff war with European countries on the Greenland issue. Upside momentum is limited in this scenario. Short term uptrend will be confirmed if the index closes above 13850.

NIFTY Analysis for 20th JAN 2026: Weekly Exp. IntraSwing levelsNIFTY Analysis for 20th JAN 2026: Weekly Exp. IntraSwing levels
🚀Follow GIFTNIFTY Post for NF levels
👇🏼Screenshot of NIFTY Spot Allday(19 Jan 2026) in 1 min TF.
^^^^^^^^^^^______________^^^^^^^^^^^^^
💥Level Interpretation / description:
L#1: If the candle crossed & stays above the “Buy Gen”, it is treated / considered as Bullish bias.
L#2: Possibility / Probability of REVERSAL near RLB#1 & UBTgt
L#3: If the candle stays above “Sell Gen” but below “Buy Gen”, it is treated / considered as Sidewise. Aggressive Traders can take Long position near “Sell Gen” either retesting or crossed from Below & vice-versa i.e. can take Short position near “Buy Gen” either retesting or crossed downward from Above.
L#4: If the candle crossed & stays below the “Sell Gen”, it is treated / considered a Bearish bias.
L#5: Possibility / Probability of REVERSAL near RLS#1 & USTgt
HZB (Buy side) & HZS (Sell side) => Hurdle Zone,
*** Specialty of “HZB#1, HZB#2 HZS#1 & HZS#2” is Sidewise (behaviour in Nature)
Rest Plotted and Mentioned on Chart
Color code Used:
Green =. Positive bias.
Red =. Negative bias.
RED in Between Green means Trend Finder / Momentum Change
/ CYCLE Change and Vice Versa.
Notice One thing: HOW LEVELS are Working.
Use any Momentum Indicator / Oscillator or as you "USED to" to Take entry.
━━━━━━━━━━━━━━━━━━━━━━━━━━━━━━━━━━━━━━━━━━━
⚠️ DISCLAIMER:
The information, views, and ideas shared here are purely for educational and informational purposes only. They are not intended as investment advice or a recommendation to buy, sell, or hold any financial instruments. I am not a SEBI-registered financial adviser.
Trading and investing in the stock market involves risk, and you should do your own research and analysis. You are solely responsible for any decisions made based on this research.
"As HARD EARNED MONEY IS YOUR's, So DECISION SHOULD HAVE TO BE YOUR's".
━━━━━━━━━━━━━━━━━━━━━━━━━━━━━━━━━
❇️ Follow notification about periodical View
💥 Do Comment for Stock WEEKLY Level Analysis.🚀
📊 Do you agree with this view?
✈️ HIT THE PLANE ICON if this technical observation resonates with you. It will Motivate me.

Band of Baroda Buy @ 307As per multiyear break out on weekly chart
+
Fibonacci
Buy = 307
TP 1 = 346 or Fib level of 1.618
TP 2 = 424
TP 3 = 539 or Fib level of 2.618
Very Long-term target = 1959.8

NIFTY Analysis for 19th JAN 2026: IntraSwing Spot levelsNIFTY Analysis for 19th JAN 2026: IntraSwing Spot levels
🚀Follow GIFTNIFTY Post for NF levels
^^^___❇️❇️❇️❇️❇️❇️❇️❇️❇️___^^^
💥Level Interpretation / description:
L#1: If the candle crossed & stays above the “Buy Gen”, it is treated / considered as Bullish bias.
L#2: Possibility / Probability of REVERSAL near RLB#1 & UBTgt
L#3: If the candle stays above “Sell Gen” but below “Buy Gen”, it is treated / considered as Sidewise. Aggressive Traders can take Long position near “Sell Gen” either retesting or crossed from Below & vice-versa i.e. can take Short position near “Buy Gen” either retesting or crossed downward from Above.
L#4: If the candle crossed & stays below the “Sell Gen”, it is treated / considered a Bearish bias.
L#5: Possibility / Probability of REVERSAL near RLS#1 & USTgt
HZB (Buy side) & HZS (Sell side) => Hurdle Zone,
*** Specialty of “HZB#1, HZB#2 HZS#1 & HZS#2” is Sidewise (behaviour in Nature)
Rest Plotted and Mentioned on Chart
Color code Used:
Green =. Positive bias.
Red =. Negative bias.
RED in Between Green means Trend Finder / Momentum Change
/ CYCLE Change and Vice Versa.
Notice One thing: HOW LEVELS are Working.
Use any Momentum Indicator / Oscillator or as you "USED to" to Take entry.
━━━━━━━━━━━━━━━━━━━━━━━━━━━━━━━━━━━━━━━━━━━
⚠️ DISCLAIMER:
The information, views, and ideas shared here are purely for educational and informational purposes only. They are not intended as investment advice or a recommendation to buy, sell, or hold any financial instruments. I am not a SEBI-registered financial adviser.
Trading and investing in the stock market involves risk, and you should do your own research and analysis. You are solely responsible for any decisions made based on this research.
"As HARD EARNED MONEY IS YOUR's, So DECISION SHOULD HAVE TO BE YOUR's".
━━━━━━━━━━━━━━━━━━━━━━━━━━━━━━━━━
❇️ Follow notification about periodical View
💥 Do Comment for Stock WEEKLY Level Analysis.🚀
📊 Do you agree with this view?
✈️ HIT THE PLANE ICON if this technical observation resonates with you. It will Motivate me.

POLICYBZR – Textbook Tweezer Bottom at Trendline SupportPOLICYBZR has formed a perfect Tweezer Bottom exactly at a rising demand / support trendline, indicating strong buying interest at lower levels. Sellers tried to push price below this zone but failed twice, which confirms absorption of supply.
This reaction is not random — it’s happening:
At a well-defined support trendline
After a controlled decline
With immediate bullish response, showing rejection of lower prices
What this means structurally:
As long as price holds above the tweezer low, downside risk remains limited
The first upside test will be the nearby supply zone / previous consolidation area
A sustained move above that zone can shift the structure back toward higher highs
This is a low-risk observation zone, where price action confirmation matters more than speed.
No indicators needed — pure price behavior is speaking.

COLPAL – Compression Near Lower Channel | Early Strength EmerginCOLPAL has been moving inside a long-term falling channel, respecting both the upper resistance and lower support trendlines. Recently, price has rebounded from the lower channel support, indicating demand at lower levels.
The structure shows gradual compression near the support zone, suggesting selling pressure is reducing. Today’s move signals early strength, but the trend is not confirmed yet.
As long as price holds above the lower trendline, the structure remains constructive.
A decisive breakout above the falling channel would be the real confirmation of trend reversal.
Until then, this remains a wait-and-watch zone, where price behavior matters more than prediction.
Simple chart. Clear structure. Patience required.

Equitas Small Finance Bank – Swing Trade ViewPrice has broken out of a long-term falling channel, signaling a trend shift from bearish to bullish.
Post-breakout structure shows higher highs and higher lows, confirming strength.
Price has broken out of a long-term falling channel, signaling a trend shift from bearish to bullish.
Buy Zone :
₹66–₹67 on pullback to former resistance turned support
Or on daily close above ₹70 for continuation
Stop-Loss:
Below ₹65 (structure-based)
Targets:
T1: ₹73–₹75
T2: ₹78–₹80

EURJPY – High-Probability Reversal from Discount ZoneTrade Idea
EURJPY has tapped a major higher-timeframe discount zone and formed a strong reaction from the extreme demand area. Price swept the liquidity resting below 182.80–182.60, tapped the Strong Low, and instantly rejected with a long wick—signaling aggressive buy-side interest.
Key Confluences
Liquidity Sweep: Equal lows + previous liquidity at the discount zone fully taken.
Strong Demand Zone Tested: Price wicked into a deep discount FVG + demand block.
Rejection Candle: Strong bullish reaction, showing buyers defending the level.
Structure Context: Market is in a corrective down-move, but HTF trend remains bullish.
FVG Above as Magnet: A clean inefficiency up to 183.80–184.10, ideal for targets.
Entry: 182.85 – 183.05 (discount zone tested + confirmation wick)
Stop Loss: Below the sweep — 182.45
Take Profit 1: 183.50 (first FVG fill)
Take Profit 2: 183.90 (premium zone / previous BOS area)
Take Profit 3: 184.15 (HTF supply & equilibrium)
Risk-Reward: ~1:3.2 to 1:4 depending on entry refinement
Probability: High—due to liquidity sweep + demand tap + immediate rejection
EURJPY has reached a major higher-timeframe discount zone and swept downside liquidity. Price tapped into a strong demand block and instantly rejected, signaling potential bullish reversal. With clean imbalances above and prior structural levels acting as magnets, this area provides a high-probability long setup. As long as price holds above 182.60, bullish targets remain valid.
Disclaimer: for educational purpose only.

Gold Trapped in Liquidity Range – Expansion PendingGold is currently trading in a post-impulse environment after completing a clear Elliott Wave advance. With the higher-timeframe impulse exhausted, price action has transitioned into a controlled consolidation driven by liquidity, rather than trend continuation.
At this stage, the market is not trending — it is preparing.
Market Structure & Liquidity Context
Price is now boxed between a well-defined Equal High and Equal Low, forming a classic liquidity range. This structure suggests that Smart Money is engineering both sides of liquidity before committing to the next directional move.
The upper range aligns with premium pricing, where buy-side liquidity is resting.
The lower range sits in discount territory, overlapping with higher-timeframe demand.
This environment favors rotation and stop-hunt behavior, not impulsive expansion.
Key Trading Scenarios
🔴 Sell reaction at the highs
If price pushes above the Equal High and taps into the 4688–4690 premium zone , this area is expected to attract sell-side interest. A clear rejection or hesitation here would signal that buy-side liquidity has been taken, opening the door for a rotation back into the range.
🟢 Buy reaction at the lows
If price drops and reaches the 4388–4390 discount zone , this level becomes a key area to watch for support. Strong rejection or stabilization would suggest Smart Money defense, favoring a bounce back toward equilibrium.
Expectation & Bias
This is a rotation market, not a trend market.
Directional continuation should only be expected after a clear break and acceptance outside the range.
Until then:
Patience > prediction
Liquidity > indicators
Reaction > anticipation
Let price show its hand.
💬 Do you expect expansion to come from the highs or the lows first?
Your perspective matters — share your view.

Part 1 Technical Analysis VS. Institutional Trading Common Mistakes Traders Make
Buying OTM options expecting miracles
No stop-loss on option selling
Trading without understanding volatility
Getting trapped during reversal
Overtrading
Trading during low liquidity
Holding positions during events without hedges

Short term Analysis of RelianceWrap up:-
Reliance is making a wxy pattern in wave c and has completed its wave w at 1581 and wave x is expected to be completed near 1450. Thereafter, Reliance will head towards wave y.
What I’m Watching for 🔍
Buy Reliance in the range of 1460-1480 sl 1440 for a target of 1578-1687.
Disclaimer: Sharing my personal view — only for educational purpose not financial advice.
"Don't predict the market. Decode them."

HCLTECHHCLTECH
bullish trend is Showing on the chart.
buy signals in
technical indicators and
Ascending Channel chart pattern.
BUYING RANGE 1690/1700
Watch for a retest 1690/1700 to sustain the bullish trend. If the resistance holds, there could be a retest towards 1480/1500 and an uptrend from here.

iifl finance 5min chart pe clean bullish breakout iifl finance 5min chart pe clean bullish breakout dikh raha hai
price ne descending trendline ke upar strong breakout diya hai with volume support. consolidation ke baad higher highs & higher lows ban rahe hain, jo bullish continuation signal hai.
🔹 trade plan (intraday / short-term swing)
buy above: 651
stop loss: 639
targets:
t1: 6500
t2: 6530
🔹 technical view
trendline breakout confirmed
price vwap ke upar sustain kar raha hai
volume spike breakout candle pe visible
retest zone near 645–647 holding strong
jab tak price 639 ke upar hold karta hai, bullish bias intact rahega. below 639 close aane par setup invalidate ho jayega.
risk reward approx 1:2+

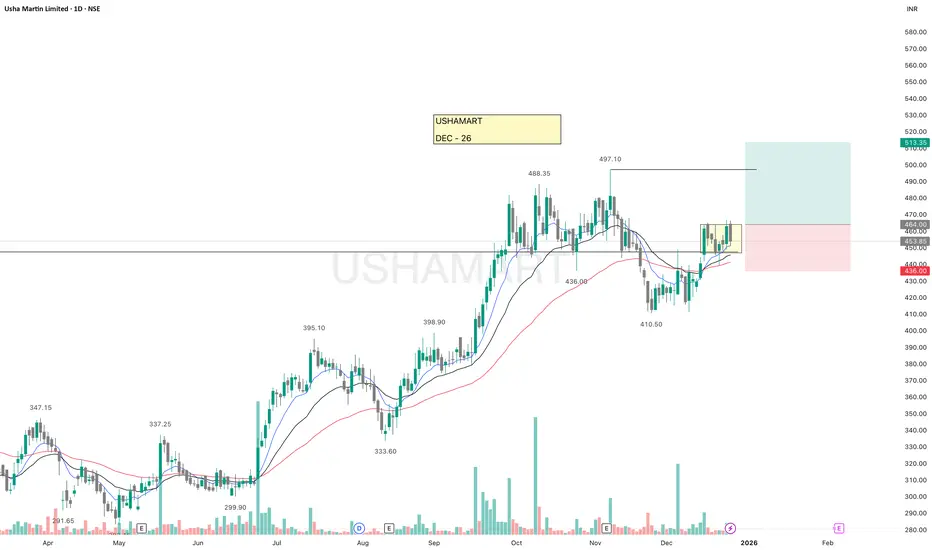
USHAMARTUSHAMART is looking good.
It recently broke above a key resistance and successfully retested the breakout zone. Since then, price has been consolidating in a tight range above all major EMAs and resistance, indicating strength.
The overall market structure remains bullish, suggesting a higher probability of further upside.
Keep this on your watchlist for paper trading and observation.
✅ If you like my analysis, please follow me here as a token of appreciation :)
in.tradingview.com/u/SatpalS/
📌 For learning and educational purposes only, not a recommendation. Please consult your financial advisor before investing.
Part 2 Technical Analysis VS. Institutional Trading Option Expiry Dynamics
On expiry day:
Theta decay is fastest.
Premium collapses quickly.
OTM options lose value rapidly.
Scalping becomes intense.
Liquidity is high.
Many traders prefer weekly expiry trading for quick momentum.

LTFLTF
bullish trend is Showing on the chart.
buy signals in
technical indicators and
Ascending Channel chart pattern.
BUYING RANGE 295/300
Watch for a retest 295/300 to sustain the bullish trend. If the resistance holds, there could be a retest towards 270/280 and an uptrend from here.
