Weekly Market Cycle Bottom to Expansion🔍 Overview
This chart presents a Weekly market cycle analysis, highlighting how price typically transitions from a major bottom into a strong expansion phase, followed by periodic pullbacks and resistance tests. The structure reflects a healthy trending environment where momentum builds gradually, pauses near key levels, and then attempts continuation.
By comparing the current market phase with historical behavior, the chart illustrates how price respects long-term support, forms peaks near resistance zones, and sustains upward expansion through controlled pullbacks. This approach helps in understanding broader market behavior rather than short-term fluctuations, making it suitable for long-term market observation and structure-based analysis.
⸻⸻⸻⸻⸻⸻⸻⸻⸻⸻⸻⸻⸻
📊 Chart Observations
1️⃣ Major Market Bottom Formation
The chart starts with a well-defined long-term bottom, where sustained selling pressure exhausts and price stabilizes.
This phase reflects strong accumulation and forms the foundation for a new structural cycle.
2️⃣ Strong Bullish Expansion Phase
From the bottom, price enters a powerful expansion phase, breaking multiple resistance levels and forming higher highs and higher lows.
This behavior indicates broad market participation and long-term trend strength, often driven by institutional flows.
3️⃣ Price Reaches a Key Resistance / Peak Zone
After a prolonged rally, price approaches a major resistance and all-time high region.
Here, momentum temporarily slows as profit booking appears, leading to controlled pullbacks rather than structural weakness.
4️⃣ Healthy Pullbacks Within an Ongoing Structure
Pullbacks during the expansion phase remain shallow and occur above major support zones.
This reflects trend sustainability, where demand continues to absorb supply without breaking the broader structure.
5️⃣ Historical Behavior Repeating in the Current Phase
The current market phase closely mirrors past expansion cycles seen on the left side of the chart.
Previous resistance zones are tested again, suggesting a repeating long-term market rhythm rather than random price movement.
🔮 Forward Outlook (Market Continuation Context)
As long as price holds above the broader support zone and consolidates near resistance, the structure favors continuation toward higher levels over time.
Sustained acceptance above resistance would open the path for the next expansion leg in the long-term cycle.
⸻⸻⸻⸻⸻⸻⸻⸻⸻⸻⸻⸻⸻
🧾 Summary
• Market structure remains aligned with a long-term expansion cycle.
• Pullbacks appear corrective, not trend-breaking.
• Historical patterns suggest continuation once consolidation near resistance completes.
⸻⸻⸻⸻⸻⸻⸻⸻⸻⸻⸻⸻⸻
⚠️ Disclaimer [ /b]
📘 For educational purposes only
🙅 Not SEBI registered
❌ Not a buy/sell recommendation
🧠 Shared purely for learning and pattern understanding
📊 Not Financial Advice
Community ideas

$PUMP PRICE OUTLOOK | 500%–1000% POTENTIAL? #PUMP Is Trading In A Bullish Expansion Zone After Breaking Long-Term Descending Resistance On The Daily Chart.
Price Has Completed A Prolonged Distribution → Correction Phase And Is Now Showing Early Reversal Signals.
Current Technical Structure:
✅ Long-Term Descending Trendline Break Confirmed
✅ Descending Wedge Breakout Structure
✅ Strong HTF Demand Zone Holding (0.0023–0.0021)
✅ Multiple Support Reclaims Indicate Accumulation
✅ Strength Signal: Bullish Above $0.0021
CryptoPatel Targets: $0.00449 / $0.00644 / $0.00872 / $0.015 / $0.026
As Long As PUMP/USDT Holds Above $0.0021, The Bullish Bias Remains Intact.
This Is A High-Risk, High-Reward Accumulation Setup With Asymmetric Upside Potential.
Invalidation: Daily Close Below $0.0021
TA Only. Not Financial Advice. DYOR.

LT (Larsen & Toubro Limited)LT is looking attractive near 3835 - 3780 Rs zone. RSI is also at oversold zone (29). Considering it for short term move with upside potential of 5 - 8 %.
Target 1 : 3980 - 4000 RS
Target 2 : 4080 - 4100 Rs
Disclaimer : The Above shared Content is for information and education purposes only and should not be treated as investment or trading advice. Im not SEBI registered, Contact your financial advisor before any investment.

HDFCBANK Level Analysis: Intraswing for 19th JAN 2026✈️ HDFCBANK Level Analysis: Intraswing for 19th JAN 2026
🚀Follow & Compare Daily Intraswing Post for Positioning much accurate level to Take Trade
💥Level Interpretation / description:
L#1: If the candle crossed & stays above the “Buy Gen”, it is treated / considered as Bullish bias.
L#2: Possibility / Probability of REVERSAL near RLB#1 & UBTgt
L#3: If the candle stays above “Sell Gen” but below “Buy Gen”, it is treated / considered as Sidewise. Aggressive Traders can take Long position near “Sell Gen” either retesting or crossed from Below & vice-versa i.e. can take Short position near “Buy Gen” either retesting or crossed downward from Above.
L#4: If the candle crossed & stays below the “Sell Gen”, it is treated / considered a Bearish bias.
L#5: Possibility / Probability of REVERSAL near RLS#1 & USTgt
HZB (Buy side) & HZS (Sell side) => Hurdle Zone,
*** Specialty of “HZB#1, HZB#2 HZS#1 & HZS#2” is Sidewise (behaviour in Nature)
Rest Plotted and Mentioned on Chart
Color code Used:
Green =. Positive bias.
Red =. Negative bias.
RED in Between Green means Trend Finder / Momentum Change
/ CYCLE Change and Vice Versa.
Notice One thing: HOW LEVELS are Working.
Use any Momentum Indicator / Oscillator or as you "USED to" to Take entry.
━━━━━━━━━━━━━━━━━━━━━━━━━━━━━━━━━━━━━━━━━━━
⚠️ DISCLAIMER:
The information, views, and ideas shared here are purely for educational and informational purposes only. They are not intended as investment advice or a recommendation to buy, sell, or hold any financial instruments. I am not a SEBI-registered financial adviser.
Trading and investing in the stock market involves risk, and you should do your own research and analysis. You are solely responsible for any decisions made based on this research.
"As HARD EARNED MONEY IS YOUR's, So DECISION SHOULD HAVE TO BE YOUR's".
━━━━━━━━━━━━━━━━━━━━━━━━━━━━━━━━━
❇️ Follow notification about periodical View
💥 Do Comment for Stock WEEKLY Level Analysis.🚀
📊 Do you agree with this view?
✈️ HIT THE PLANE ICON if this technical observation resonates with you. It will Motivate me.

HDFC Bank Q3 FY26 Earnings Analysis (Announced January 17, 2026)🌈HDFC Bank Q3 FY26 Earnings Analysis (Announced January 17, 2026)
✅ HDFC Bank, India's largest private sector lender by assets, reported a solid Q3 FY26 (October-December 2025) performance, with net profit beating analyst estimates amid stable asset quality, moderate deposit growth, and improving lending margins. The results reflect resilience in a challenging environment marked by deposit mobilization pressures, regulatory scrutiny on unsecured loans, and global uncertainties like potential US tariffs on remittances. Key positives include double-digit loan growth, NPA improvements, and controlled costs, though deposit growth lagged peers, leading to a slight liquidity drag. Management emphasized profitable growth, digital advancements, and LDR (loan-to-deposit ratio) reduction toward FY27 targets.
📢Key Financial Highlights
The bank delivered YoY profit growth ahead of expectations, with asset quality holding steady. Here's a summary table comparing actuals to estimates (median from 6-8 brokerages) and YoY/QoQ changes👇🏼:
in Table format on Chart.
🔔Beat/Miss Analysis: PAT beat estimates by ~1-2% on better-than-expected NIM stability and fee income, despite higher opex from labor code provisions (₹800 Cr one-off). NII met low-end estimates, reflecting deposit cost pressures. Overall, a "better-than-feared" quarter, with no major slippages in unsecured portfolios.
🏹Segment-Wise Analysis
HDFC Bank's diversified model showed balanced growth, with wholesale and SME segments outperforming retail amid regulatory curbs on consumer loans.
☂️Advances (Loans): Gross advances at ₹28.45 lakh Cr, up 11.9% YoY (from ₹25.42 lakh Cr); advances under management +9.8% YoY. Segment breakdown: Retail +6.9% (muted due to unsecured slowdown), SME +17.2%, Corporate/Wholesale +10.3%, Overseas +1.7% of total. Growth beat estimates of 12-14%, signaling tailwinds from economic recovery.
☔Deposits: Average deposits ₹27.52 lakh Cr, +12.2% YoY; CASA ₹8.98 lakh Cr, +9.9% YoY (+2.4% QoQ). LDR remains elevated at ~85-90%, with plans to reduce to 85% by FY27 through deposit mobilization. Lagged estimates of 10-12% YoY, highlighting industry-wide challenges.
✅Asset Quality: Gross NPA ratio stable at 1.24% (0.97% ex-agri), down from 1.42% YoY; Net NPA at 0.42%. No major deteriorations; provisions controlled, aiding PAT beat. Management noted proactive risk management in unsecured segments.
🕸️Other Income & Costs: Fee income supported revenue; core cost-to-income ratio at 39.2% (stable). Opex up due to employee benefits under New Labour Code, but adjusted figures show efficiency.
🔥Management and Analyst Commentary
💯Management: In the earnings call, CEO Sashidhar Jagdishan highlighted "profitable growth" tailwinds from falling funding costs and CASA recovery. Emphasis on digital/cross-sell for retail revival, SME/corporate momentum, and LDR reduction to 85-90% by FY27. Outlook: Loan growth targeted at 12-15% for FY27, NIM expansion to 3.6-3.7%; cautious on unsecured amid regulations, but optimistic on remittances despite tariffs.
📢Analysts: Positive reactions—beat on PAT/asset quality seen as confidence booster. Motilal Oswal/Yes Securities maintain 'Buy' with targets ₹1,050-1,200 (20-30% upside from current ~₹930). Concerns: Deposit lag could pressure NIM if rates rise; positives: SME growth and NPA stability. Consensus: Q3 as "trough," with FY27 PAT growth 15-20%.
🏹🎯⁉️✍🏼❎☂️✅❌🌈💯🔥👇🏼🐢📢🔔
🌈Impact on Stock Price for Incoming Days
✅Immediate Reaction: Post-results (after-hours on Jan 17), HDFC Bank shares (HDFCBANK.NS) saw mild positive sentiment in extended trading, with ADRs up ~1-2% in US sessions. Domestic close on Jan 17: +0.56% at ₹931.15 (pre-results), but analysts expect a gap-up on Monday (Jan 19) due to PAT beat and stable NPAs. Volume surged 15-20% on Jan 17 amid anticipation.
✅Short-Term (Next 5-10 Days): Likely 3-7% upside if market digests positives (e.g., NIM tailwinds, growth outlook), pushing toward ₹950-1,000. Support at ₹900-920; resistance ₹950. Banking sector (Bank Nifty) could rally 1-2%, as HDFC's ~30% weight amplifies impact. Risks: Broader market weakness from FII outflows or tariff news could cap gains; sentiment on Social Network Discussions/forums positive, viewing results as "reassuring."
💯Medium-Term Outlook: Bullish, with 15-25% potential upside in 3-6 months to targets ₹1,100-1,200, driven by FY27 growth acceleration and valuation re-rating (current P/B ~2.5x vs. historical 3x). Stock down ~6% YTD amid deposit concerns, but results alleviate fears—bias: Buy on dips for long-term investors. Catalysts: Q4 festive lending; risks: Regulatory tightening on unsecured.
✅✅✅✅✅✅✅✅✅✅✅✅✅✅✅✅✅✅✅✅✅
🚀Follow & Compare Daily pot Post for Day Trading Levels.
💥Level Interpretation / description:
L#1: If the candle crossed & stays above the “Buy Gen”, it is treated / considered as Bullish bias.
L#2: Possibility / Probability of REVERSAL near RLB#1 & UBTgt
L#3: If the candle stays above “Sell Gen” but below “Buy Gen”, it is treated / considered as Sidewise. Aggressive Traders can take Long position near “Sell Gen” either retesting or crossed from Below & vice-versa i.e. can take Short position near “Buy Gen” either retesting or crossed downward from Above.
L#4: If the candle crossed & stays below the “Sell Gen”, it is treated / considered a Bearish bias.
L#5: Possibility / Probability of REVERSAL near RLS#1 & USTgt
HZB (Buy side) & HZS (Sell side) => Hurdle Zone,
*** Specialty of “HZB#1, HZB#2 HZS#1 & HZS#2” is Sidewise (behaviour in Nature)
Rest Plotted and Mentioned on Chart
Color code Used:
Green =. Positive bias.
Red =. Negative bias.
RED in Between Green means Trend Finder / Momentum Change
/ CYCLE Change and Vice Versa.
Notice One thing: HOW LEVELS are Working.
Use any Momentum Indicator / Oscillator or as you "USED to" to Take entry.
━━━━━━━━━━━━━━━━━━━━━━━━━━━━━━━━━━━━━━━━━━━
⚠️ DISCLAIMER:
The information, views, and ideas shared here are purely for educational and informational purposes only. They are not intended as investment advice or a recommendation to buy, sell, or hold any financial instruments. I am not a SEBI-registered financial adviser.
Trading and investing in the stock market involves risk, and you should do your own research and analysis. You are solely responsible for any decisions made based on this research.
"As HARD EARNED MONEY IS YOUR's, So DECISION SHOULD HAVE TO BE YOUR's".
━━━━━━━━━━━━━━━━━━━━━━━━━━━━━━━━━
❇️ Follow notification about periodical View
💥 Do Comment for Stock WEEKLY Level Analysis.🚀
📊 Do you agree with this view?
✈️ HIT THE PLANE ICON if this technical observation resonates with you. It will Motivate me.

$FET Price Prediction | 5000% Potential From Macro Support?Market Context
NYSE:FET is currently trading at a major Higher Timeframe (HTF) support zone after a deep corrective move from cycle highs.
Price has retraced ~97% from ATH, a level historically associated with long-term re-accumulation phases.
Technical Overview (HTF)
✔ Macro ascending channel support intact (since 2020)
✔ Strong HTF demand zone at $0.20 – $0.19
✔ 97%+ retracement from ATH completed
✔ Channel support + demand confluence holding
✔ Bullish structure as long as price holds above $0.19
This area represents a high-risk / high-reward macro support with asymmetric upside potential.
Upside Targets (CryptoPatel Levels) $0.60 / $1.00 / $2.80 / $5.00 / $10.00
➡️ This implies a potential ~50x (5000%) move if the macro structure plays out.
⚠️ Invalidation Level
❌ HTF close below $0.19
A breakdown below this level would invalidate the macro bullish thesis.
Conclusion
As long as FET/USDT holds above $0.19, the macro bullish bias remains valid.
This zone could act as a long-term accumulation base before the next expansion phase.
TA Only | Not Financial Advice
Always manage risk and DYOR.

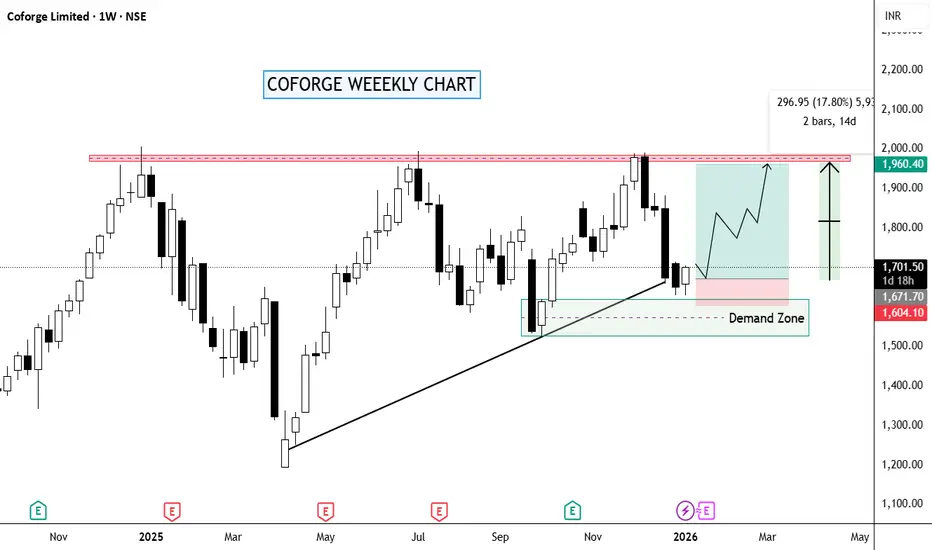
COFORGE - I AM LONG Bullish outlook on Coforge, identifying a high-probability reversal setup. The stock has corrected significantly from its highs but has now established a robust demand zone around the 1,600–1,615 levels (visible as the consolidation base in your chart).
Fundamental Catalysts: The recent correction offers a "value buy" opportunity, underpinned by the $2.35B acquisition of Encora (announced late Dec 2025). This deal significantly boosts Coforge’s AI and data engineering capabilities, supporting management's target of a $2B revenue run-rate by Q4FY26. Additionally, robust Q2 deal wins ($514M) and margin expansion provide a strong floor for valuations.
Technical Targets: The price action indicates a bounce from oversold territory (RSI < 30).
1st Target (1,735): This level acts as immediate resistance and aligns with the mean reversion to the short-term moving averages.
2nd Target (1,820): A sustained move above 1,735 opens the path to 1,820, filling the gap towards the 50-day EMA.
Risk Management: A daily close below 1,600 would invalidate this reversal setup.

Weakness in daily time frame but at SUPPORT in weekly TF!!As we can see NIFTY tried to recover after hitting demand zone multiple times but ended up forming an inverted hammer candle showing the dominance of seller but on the bigger time frame, it can still be seen trading above important demand zone and a doji kinda candle in weekly time frame so we may expect NIFTY to recover sharply if manages to sustain itself above 25900 so plan your trades accordingly and keep watching this important zones.

Bitcoin gearing for upmoveBitcoin has formed a base around its earlier resistance. Now, in the higher time frame, it has started up move while in lower time frame, it's showing a possible retracement. Either path '1' or '2' can be taken, where it will dip on its trendline first (removing weak hands) and rise.

COFORGE – Weekly Chart | Clean Technical ViewNSE:COFORGE
🔹 Trendline + 50 EMA Support:
Price has pulled back into a rising weekly trendline, and the 50 EMA is sitting right there. This confluence is the key zone.
🔹 Price Action:
Rejection from 1950–2000 came with a controlled pullback, not panic selling. That tells me distribution isn’t aggressive yet.
🟢 Buy Zone (Support-based): 1680 – 1700
NIFTYIT Sector About to go for a Breakout attempt
🔹 Bias:
Above trendline + 50 EMA → bullish bias intact
Weekly close above 1750–1780 → scope to retest 1900–2000
Weekly close below demand → bullish view invalid
Keep Learning,
Happy Trading.
Long may be possible Expect this but need patient to follow the Trend. Pattern look like trying to make higher lower and Trent will be broken sooner.
See the trend movement carefully

Bajaj Auto Knocks on ResistancePrice is currently trading near 9,888, pressing into a major resistance / supply zone around 9,900–10,000 . The broader decline from the highs continues to unfold as a complex corrective structure , with the ongoing rise best labeled as Wave X .
The advance into this zone lacks impulsive strength and shows overlapping, corrective characteristics , keeping the larger bearish structure intact . This favors the view that Wave X is approaching completion , not the start of a new uptrend.
If price rejects from this resistance band , the next phase should begin as a Wave Y decline , marking a fresh downside leg of the correction. Risk is clearly defined near the recent highs , making this zone attractive from a short-side perspective .
This is a sell-on-rejection area , not a place to chase strength.
Disclaimer: This analysis is for educational purposes only and does not constitute investment advice. Please do your own research (DYOR) before making any trading decisions.

breakout on the way📈 Tata Consumer Products | Breakout Loading? 👀
Tata Consumer Products is pressing against a long-term downward trendline resistance after a strong recovery from the 2024–25 lows.
Price structure shows higher lows, indicating accumulation near resistance.
🔍 Technical View:
• Multiple tests of the same trendline
• Higher lows → buying pressure building
• Momentum positive, but confirmation pending
📊 Key Levels to Watch:
• Breakout confirmation: Daily close above ₹1,210–1,220
• Immediate support: ₹1,150–1,165
📌 Bias: Bullish only on confirmation
⚠️ Disclaimer: Educational purpose only. Not financial advice.
#TataConsumer #BreakoutWatch #AboutToBreak #StockMarketIndia #SwingTrading #TechnicalAnalysis #IndianStocks #PriceAction

MCX Silver: Healthy Dip Before Next RallyMCX Silver is in a strong long-term uptrend on the daily chart. The market has already completed wave 1, 2, and a strong wave 3 upward. After this big rise, price is now expected to make a normal correction (wave 4). This pullback can come toward the 236,000 area, which is an important support zone. As long as price stays above this support, the overall trend remains bullish. After wave 4 is completed, Silver is expected to start wave 5, which can push prices to new highs. In short, the trend is up, and any dip is a healthy correction, not weakness.
Stay Tuned :)
@Money_Dictators

Container Corporation of India Ltd – Head & Shoulders in PlayOn the monthly chart, CONCOR is showing a Head & Shoulders formation. The neckline around ₹480–500 is the key level to watch.
A breakdown below the neckline could confirm bearish continuation.
A successful hold above it may simply lead to sideways consolidation instead of a full breakdown.
The neckline is the make-or-break zone for the stock in the coming months.
Disclaimer: This analysis is for educational purposes only and does not constitute investment advice. Please do your own research (DYOR) before making any trading decisions.

USDJPY 4HR T/F ANALYSIS -----
usdjpy 4hr t/f ----- breakdown of curve support which name is black mind curve after breakdown we can measure previous pattern now current scenario previous supply can measure so we can go with trend into down side until supply will not complete /
after supply complete we can see any positive candle on retesting area then we can see demand on retesting then we can go with trend _ remember trend are over all bullish ok ----

NSE DEFENCE STOCK ( Bharat Dynamics ltd ) Week le time fram of stock of (NSE) (/Bharat Dynamics ltd /) look good for futer accourding to me target is on your sceen .
. \ If it break level of $1556 price then ther is heigh problaty of going up . ( Accourding to Me ).
. (I AM NOT SEBI REGISTER PLISE ANALYISE YOUR SELF ALSO ) THANK YOU.
THIS IS MY POINT OF VIEW ANALYSIS BY YOUR SELF ALOS I AM NOT (SEBI) REGISTER .
WHAT YOU THINK SHER YOUR POIN ON IT THANK YOU .

Chumtrades XAUUSD H2 | Is the Liquidity Sweep Over?Chumtrades – XAUUSD H2 | Has the Liquidity Sweep Finished, or Is There More Downside Ahead?
On Friday, the market reacted strongly after Trump’s comments regarding Kevin Hassett, when Trump expressed his preference for Hassett to remain in his current role rather than taking a new position.
👉 As a result, gold printed a long wick liquidity sweep back into the prior ATH zone, around 4530–453X, before closing back above 456X.
This brings us to the key question:
Was this sweep enough for the BUY side, or is the market still looking to test lower levels?
Political developments will be a key driver for gold direction in the coming week.
📰 Key Political Factors to Monitor
1. Trump – Greenland
The US has imposed 10% tariffs, with the possibility of increasing them to 25% on countries that do not support the annexation of Greenland
No fixed deadline, tariffs remain until Greenland becomes part of the US
→ This is a supportive factor for gold, especially amid rising geopolitical uncertainty
→ This news may directly impact the market open
→ If price reacts strongly, avoid SELLs near resistance
2. Iran – Protests
Monitor the risk of Trump returning to direct intervention
→ A potential headline-driven volatility trigger
🟢 Key Support Zones to Watch
4530 – 4535
4515 – 4510
4480 – 4482
4462
4410 – 4407
🔴 Key Resistance Zones to Monitor
4618 – 4628
4648 – 4650
4655 – 4660
4698 – 4699
⚠️ Trading Notes
Price levels are zones for observation, not instant entry points
SELL setups around 462X must be evaluated based on news reaction
If momentum accelerates on headlines → stay flat and avoid trading against strength
💬 Question for the New Week
Is the market finishing its liquidity collection on the BUY side,
or was Friday’s sweep the final test before the next leg higher?
📌 Follow Chumtrades for proactive market analysis, structured trade planning, and risk management insights.

profit booked idea📉 Go Fashion (India) Ltd | Profit Booked ✅ | Trend Breakdown
Go Fashion has broken below key trendline supports after a prolonged distribution phase.
As highlighted earlier, profits were booked once price lost structure and downside momentum picked up.
🔍 What Changed Technically:
• Multiple lower highs → trend weakness
• Breakdown below rising support
• Sharp follow-through selling
• No immediate reversal signals yet
📊 Current View:
• Downtrend intact on daily timeframe
• Fresh entries only after base formation
• Avoid catching falling knife
📌 Status: ✅ Profit Booked | Capital Protected
⚠️ Disclaimer: Educational purpose only. Not financial advice.
#GoFashion #ProfitBooked #CapitalProtection #TrendBreakdown #StockMarketIndia #TechnicalAnalysis #RiskManagement #IndianStocks

Bank of India.. Targets are good but ....Bank of India..
Has formed a quiet clear Cup & Handle pattern..
From here it has the potential to move up and we can book good profit in this ..
BUT..
like i always say, its better to book small profit and Re-Enter once it retraces..
From here, it has the potential to go till 167-168..OR upto 170( incase of WIG )
One can book it around the mentioned levels or trail the profit..
After retracement it can move towards the level of 200..
Don't let the profit slip away ..
Always know your hunger..
Remember!! You can only enjoy the market if u have capital!!
All the best!! :)

XAUUSD Weekly Analysis (H4)Gold is looking strong and bullish right now.
Last week, the price moved up with good momentum and created a clear imbalance. After that, it came back down into the FVG zone and filled the gap properly, which is a healthy sign in a trending market. That retracement looks like a normal pullback, not weakness.
Now that the imbalance is filled, gold is likely preparing for the next push higher.
What I’m expecting this week
The main target for this week is the ERL zone (PWH). That level is sitting above current price, and it’s a common place where price goes to collect liquidity. So overall, the idea is simple:
✅ Gold may continue moving up toward PWH.
What to watch when price reaches ERL (PWH)
This is the important part — don’t blindly buy at the top.
When gold reaches the ERL level, one of two things can happen:
Price raids the level and reacts down
It touches or slightly breaks above PWH
Then gives a rejection and starts pulling back
(very common in gold)
Price breaks above strongly and continues
Clean breakout
Strong bullish candles
Trend continues upward

about to break📈 Hindustan Copper | Strong Rally → Resistance Zone
Hindustan Copper has delivered a sharp multi-week rally and is now facing resistance near the ₹560–575 zone, which aligns with a major historical supply area.
🔍 Technical Summary:
* Massive breakout from long-term base (Weekly)
* Vertical up-move → momentum exhaustion signals
* Intraday & daily charts show selling pressure near resistance
* Healthy consolidation / pullback expected after sharp run
📊 Current View:
* Zone ₹560–575 = Major resistance
* Fresh breakout only on strong close above ₹580
* Support to watch on pullbacks: ₹520–500
📌 Status: Rally Extended | Caution Advised
⚠️ Disclaimer: Educational purpose only. Not financial advice.
#HindustanCopper #ProfitBookingZone #StockMarketIndia #RallyStock #TechnicalAnalysis #SwingTrading #PriceAction #IndianStocks

RELIANCE: Analysis after Q3 FY26 Earnings with levels🔥 Reliance Industries Analysis AFTER Q3 FY26 Earnings
Reliance Industries Q3 FY26 Earnings Analysis (Announced January 16, 2026)
Reliance Industries Limited (RIL) reported a steady but mixed Q3 FY26 (October-December 2025) performance, with revenue growth driven by the oil-to-chemicals (O2C) and digital services segments, offsetting weaknesses in retail and upstream oil & gas. Consolidated revenue beat estimates, but net profit missed street expectations slightly due to higher depreciation, interest costs, and segment-specific pressures like lower gas realizations and retail margin squeezes. The results highlight resilience amid global challenges (e.g., US tariff fears, volatile crude prices), with management emphasizing AI integration, new energy initiatives, and consumer business expansion for long-term growth.
Key Financial Highlights
RIL's results showed modest YoY growth, with O2C recovery as a standout. Here's a summary table comparing actuals to estimates (median from 6-7 brokerages) and YoY/QoQ changes:
Table on Chart.
Beat/Miss Analysis: Revenue and EBITDA exceeded estimates, buoyed by higher O2C volumes and refining margins (GRMs at ~$11-13/bbl vs. estimates of $10-12). However, PAT missed due to elevated costs (depreciation up on capex, interest on higher debt) and upstream drags. Overall, a "stable" quarter per analysts, with no major surprises but signals of recovery in key areas.
✅Segment-Wise Analysis
✅O2C (Oil-to-Chemicals): Strong performer with revenue up 8.4% YoY to ₹1.62 lakh Cr and EBITDA up 15% YoY to ₹16,507 Cr. Gains from higher fuel cracks (diesel/petrol up 62-106% YoY), increased throughput (2% YoY), and favorable ethane cracking offset petchem weakness and freight hikes. Jio-bp outlets grew 14% YoY to 2,125, with fuel volumes +24% YoY. Positive: Domestic focus amid Russian supply issues; outlook robust on refining demand.
☔Jio (Digital Services): Revenue +12.7% YoY to ₹43,683 Cr; EBITDA +16.4% YoY to ₹19,303 Cr (margin +170 bps). ARPU rose 5.1% YoY to ₹213.7 on premium offerings; subscribers at 515.3 Mn, with 5G at 253 Mn (53% traffic). JioAirFiber at 11.5 Mn homes; Jio Hotstar MAUs 450 Mn. Management highlighted AI partnerships (e.g., Google) and enterprise monetization; no tariff hikes impacted ARPU yet. Strength: 5G leadership (65% market share); future growth in fixed wireless and AI.
☂️Retail: Revenue +8.1% YoY to ₹97,605 Cr; EBITDA up to ₹6,915 Cr. Growth tempered by festive shift, demerger effects, and GST changes; hyper-local orders ~5x YoY. Ajio bill value +20% YoY; JioMart customers +43% YoY to base; Shein app 6.5 Mn installs. Challenges: Margin pressure from offers, investments, and labor costs; snacks/beverages expanding with new capacities.
Upstream Oil & Gas : Revenue -8.4% YoY to ₹5,833 Cr; EBITDA -12.7% YoY to ₹4,857 Cr, hit by lower KG D6 volumes/realizations and maintenance costs. Positives: Increased LNG exports from North America; strong India gas demand.
✍🏼✅Management and ⁉️ Analyst Commentary
✍🏼Management: Mukesh Ambani stressed "consistent delivery" and AI/New Energy focus for sustainability. Akash Ambani on Jio's digital revolution; Isha Ambani on retail innovation. O2C emphasized domestic outperformance; E&P noted LNG trends.
]⁉️ Analysts: Views mixed—steady earnings with O2C uplift, but retail/upstream drags. Goldman Sachs/Yes Securities positive on refining recovery; ICICI sees consumer resilience. Overall rating: Buy/Hold, with targets ₹1,600-1,800, citing long-term value from diversification.
⁉️ Impact on Stock Price for Incoming Days📊as per So called Analyst Community & Social Community views, though not fully agreed. Reason behind is: High short term VOLATILITY
❎Immediate Reaction: Post-results (after-hours on Jan 16), RIL's GDRs slipped ~2% in US trading, signaling mild disappointment over PAT miss and retail softness. Domestic shares closed flat (+0.15%) at ₹1,461 pre-results; expect flat to gap-down opening on Monday (Jan 19, markets closed Jan 17-18 for weekend). Volume spiked 20-30% on Jan 16 amid anticipation.
Short-Term (Next 5-10 Days): Potential 2-5% downside if sentiment focuses on misses (e.g., flat PAT, retail slowdown), dragging Nifty (RIL ~10-12% weight). Support at ₹1,440-1,450; resistance ₹1,500. Volatility likely amid global cues (e.g., US tariffs), but bargain buying could cap losses—experts see dips as entry points.
✅Medium-Term Outlook: Positive, with analysts forecasting 10-15% upside in 3-6 months on O2C rebound, Jio 5G monetization, and retail recovery (e.g., festive Q4). Risks: Crude volatility, consumer slowdown; catalysts: AI announcements, capex updates. Bias: Accumulate on weakness for long-term holders.
🏹🎯🏹🎯🏹🎯🏹🎯🏹🎯🏹🎯🏹🎯🏹🎯🏹🎯🏹🎯🏹🎯🏹🎯
💥Level Interpretation / description:
L#1: If the candle crossed & stays above the “Buy Gen”, it is treated / considered as Bullish bias.
L#2: Possibility / Probability of REVERSAL near RLB#1 & UBTgt
L#3: If the candle stays above “Sell Gen” but below “Buy Gen”, it is treated / considered as Sidewise. Aggressive Traders can take Long position near “Sell Gen” either retesting or crossed from Below & vice-versa i.e. can take Short position near “Buy Gen” either retesting or crossed downward from Above.
L#4: If the candle crossed & stays below the “Sell Gen”, it is treated / considered a Bearish bias.
L#5: Possibility / Probability of REVERSAL near RLS#1 & USTgt
HZB (Buy side) & HZS (Sell side) => Hurdle Zone,
*** Specialty of “HZB#1, HZB#2 HZS#1 & HZS#2” is Sidewise (behaviour in Nature)
Rest Plotted and Mentioned on Chart
Color code Used:
Green =. Positive bias.
Red =. Negative bias.
RED in Between Green means Trend Finder / Momentum Change
/ CYCLE Change and Vice Versa.
Notice One thing: HOW LEVELS are Working.
Use any Momentum Indicator / Oscillator or as you "USED to" to Take entry.
━━━━━━━━━━━━━━━━━━━━━━━━━━━━━━━━━━━━━━━━━━━
⚠️ DISCLAIMER:
The information, views, and ideas shared here are purely for educational and informational purposes only. They are not intended as investment advice or a recommendation to buy, sell, or hold any financial instruments. I am not a SEBI-registered financial adviser.
Trading and investing in the stock market involves risk, and you should do your own research and analysis. You are solely responsible for any decisions made based on this research.
"As HARD EARNED MONEY IS YOUR's, So DECISION SHOULD HAVE TO BE YOUR's".
━━━━━━━━━━━━━━━━━━━━━━━━━━━━━━━━━
❇️ Follow notification about periodical View
💥 Do Comment for Stock WEEKLY Level Analysis.🚀
📊 Do you agree with this view?
✈️ HIT THE PLANE ICON if this technical observation resonates with you. It will Motivate me.
