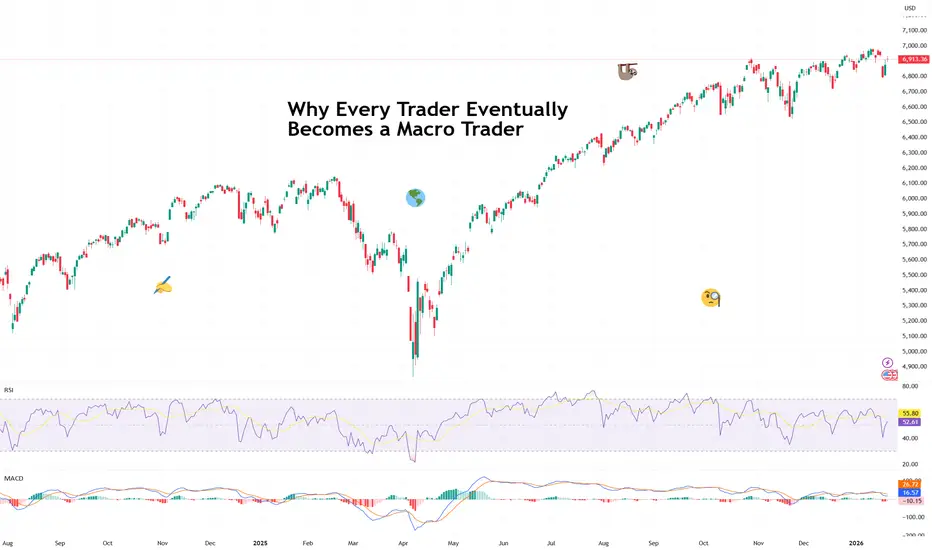
Why Every Trader Eventually Becomes a Macro Trader(And secretly enjoys it.)
Most trading careers begin the same way: a chart, a setup, a belief that price action alone is a complete and self-contained universe. Support, resistance, maybe a moving average or two. Clean. Elegant. Pure.
Macro? That’s for economists, right? Or people who say things
Related indices
What’s Driving the S&P 500 Right Now?Observing the S&P 500 at this stage, I believe the key point is not any single headline, but the fragile balance between expectations and reality. The market is no longer reacting strongly to good news, yet it tends to wobble quickly when faced with less favorable signals—classic behavior after a pr

A stock market bubble, Gold is the saviour! - January 2026A thought for the audience, have a read, comments below… does this make sense? With everything that is happening in the world.
Does this sound familiar?
1. Stock market bubble! 1929 style crash is imminent. AI tech bubble crash will collapse the indices and destroy retirement accounts if action is

US500 Forms Major Head & ShouldersUS500 Forms Major Head & Shoulders – Bearish Scenario Gaining Strength
The US500 is showing clear signs of exhaustion after a strong rally, with price action now forming a well-defined Head & Shoulders pattern on the 4H chart.
The structure is clearly visible, with the left shoulder, head, and r

The Math Retail Traders Ignore: Risk-Reward Ratios Are WorthlessA Quantitative Analysis of the Relationship Between Risk-Reward Ratios and Win Rates, and Why the Popular Money Management Narrative Fails Under Mathematical Scrutiny
1. Introduction
Open any trading course, scroll through any trading forum, or watch any YouTube tutorial on money management, and

Most will be shocked. You shouldn’t be.Most will be shocked. You shouldn’t be.
Crude oil target $400-$500 once we breakout.

The Secret Dance of SPX and Emerging MarketsThe Secret Dance of SPX and Emerging Markets
Do you imagine a crystal ball to know when a market will crash or not?
Of course it does not exist, but there are interesting tools to understand when a market could fall.
One of my favorite tools for spotting trouble is the relationship between the

5-10% Correction for S&P500 incoming SPX is at the 1.618 fib level measured from Jan 25 high and April low.
This fib level acted as a temporary resistance in all major bear Markets (except 2020) with drawdowns between 5 and 10%.
A breach of the 200 DMA and Jan 25 high and April low anchored VWAP is unlikely.

SPX500 | Futures Flat Ahead of FOMC & Mega-Cap EarningsSPX500 | Futures Flat, Volatility Loading
S&P 500 futures are trading near the flatline as markets enter a high-risk, headline-driven week. Traders are stepping back ahead of major catalysts, including key earnings releases and the Federal Reserve decision, leaving price action compressed but fragi

SPX to Money Supply WARNING!If the charts aren’t showing bubble setups, I’m not going to invent them. I post what the data shows. So please don’t shoot the messenger when I say GTFO & STFO.
And just to keep the facts straight:
Brokerage, stock, and crypto accounts are not part of M2.
Why does M2 matter?
It’s the actual spe

See all ideas
Displays a symbol's value movements over previous years to identify recurring trends.
Frequently Asked Questions
US 500 reached its highest quote on Jan 13, 2026 — 6,997.8 USD. See more data on the US 500 chart.
The lowest ever quote of US 500 is 666.8 USD. It was reached on Mar 6, 2009. See more data on the US 500 chart.
US 500 is just a number that lets you track performance of the instruments comprising the index, so you can't invest in it directly. But you can buy US 500 futures or funds or invest in its components.