Netflix Stock Dives as Crowds Reach for the Remote: Binge Over?Netflix NASDAQ:NFLX investors who hit play heading into the earnings were expecting a feel-good episode. Instead, they got a cliffhanger — and not the good kind.
Shares of the streaming giant are lower by about 5% pre-market Wednesday, even after the company posted better-than-expected fourth-qu

The best trades require research, then commitment.
Get started for free$0 forever, no credit card needed
Scott "Kidd" PoteetPolaris Dawn astronaut

Where the world does markets
Join 100 million traders and investors taking the future into their own hands.

XAUUSD (GOLD) – 4-Hour Timeframe Tradertilki AnalysisGuys,
I have prepared a XAUUSD-Gold analysis for you on the 4-hour timeframe.
My friends, the levels of 4657.0 and 4599.0 are the best buy entry points.
When price reaches these levels, I will definitely open a buy position and aim for the following targets:
My targets:
1st Target: 4690.0
2n

Why Micron’s 26,000% Legacy is Just the BeginningWhy Micron’s 26,000% Legacy is Just the Beginning
To learn how to operate in the stock market it is interesting to stop thinking about money for a while and start understanding what is actually happening.
Today I bring you an example with NASDAQ:MU a company that in less than 20 years has of

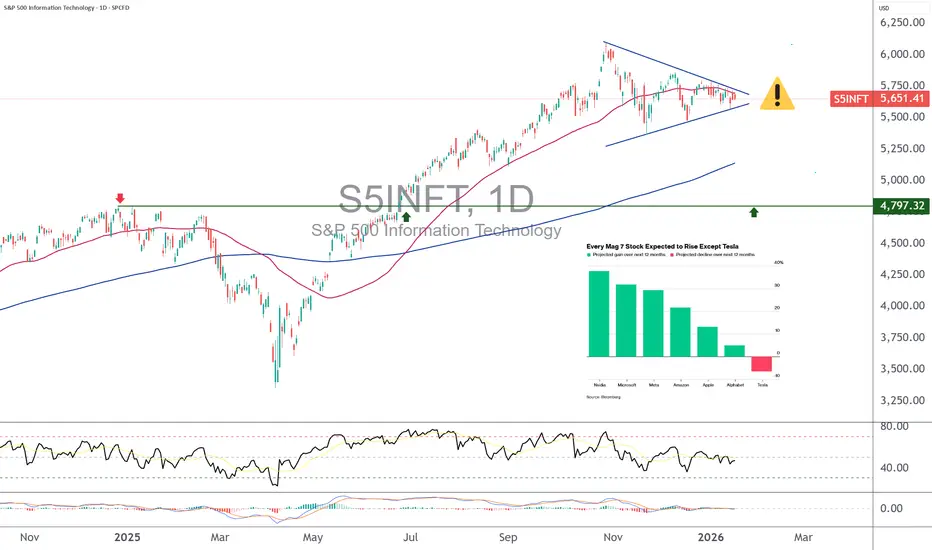
Magnificent 7: a decisive short-term technical compressionCan the S&P 500 index avoid a corrective move back toward its former all-time high zone (6,150–6,200 points) after posting nine consecutive months of gains and trading at very demanding valuation levels? This is the central question for equity markets in the first quarter of 2026, and the answer lar
GOLD: Bullish! Buys Only! Buy The Dips!In this Weekly Market Forecast, we will analyze Gold (XAUUSD) for the week of Jan. 19-24th.
Gold is climbing higher, with Trump tariff threats as winds beneath the wings!
There is no reason to consider longs! Pullbacks should be seen as dip-buying opportunities.
It's that simple.
Enjoy!
May pro

MANA Ready for a Big Breakout! (4H)📈 MANA Price Analysis | Bullish Structure & Smart Money Perspective
The overall power and primary market direction of MANA (Decentraland) remain clearly bullish, indicating strong underlying demand and positive market sentiment. Recently, the price has experienced a sharp and aggressive corrective

Silvers easy route to $100.Silver is currently positioned with a clear and relatively uncomplicated path toward the $100/oz level, largely due to a visible price vacuum above current levels. From a market structure perspective, there are only a few major zones of resistance overhead, meaning price does not need to fight throu

GOLD - A long squeeze of support could trigger growthFX:XAUUSD continues to consolidate, Friday's long squeeze (false breakdown) of support provides an opportunity for growth amid geopolitical issues...
The dollar is strengthening against the backdrop of Thursday's economic data and Trump's geopolitical actions, but against this backdrop, gold i

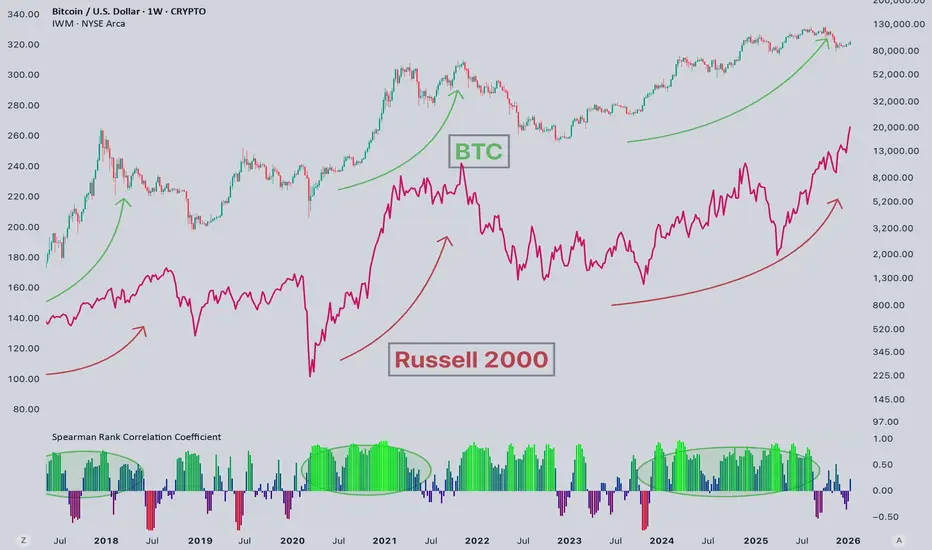
Why is Russell rising? And BTC not?#Russell2000 vs #Bitcoin, A Growing Divergence 📊
Over the last three months, the Russell 2000 has continued to grind higher, while Bitcoin has been moving lower. This divergence naturally raises the question: what’s driving such clear decoupling?
📝 Previously, I shared data showing Bitcoin divergi
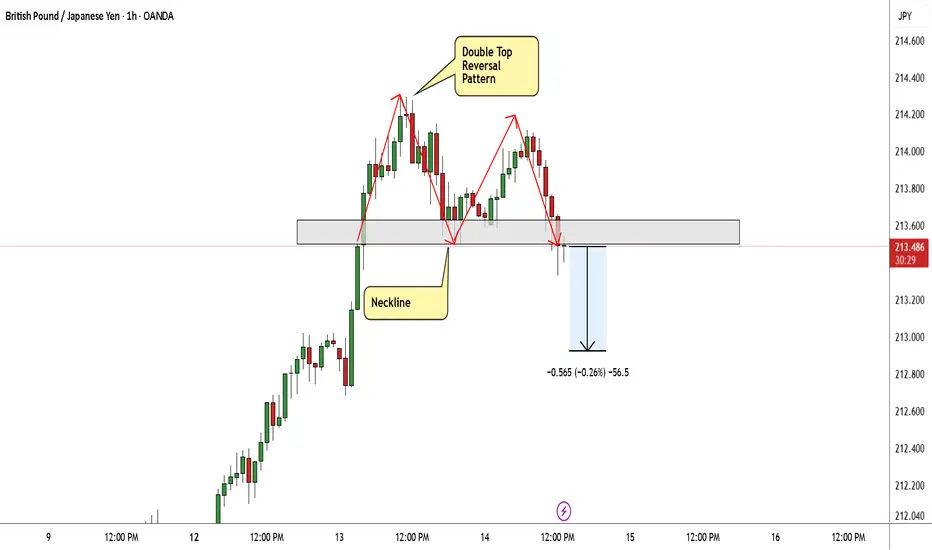
GBP/JPY Made A Reversal Pattern , Short Setup To Get 100 Pips !Here is my 1H Chart On GBP/JPY , And finally the chart made a reversal pattern The price creating a very clear reversal pattern ( double top) and the price made a very good bearish price action now from good res area But until now we have not a clear closure below our neckline to confirm the pattern
See all editors' picks ideas
Volume Cluster Profile [VCP] (Zeiierman)█ Overview
Volume Cluster Profile (Zeiierman) is a volume profile tool that builds cluster-enhanced volume-by-price maps for both the current market window and prior swing segments.
Instead of treating the profile as a raw histogram only, VCP detects the dominant volume peaks (clusters) insid

DeeptestDeeptest: Quantitative Backtesting Library for Pine Script
━━━━━━━━━━━━━━━━━━━━━━━━━━━━━━━━━━
█ OVERVIEW
Deeptest is a Pine Script library that provides quantitative analysis tools for strategy backtesting. It calculates over 100 statistical metrics including risk-adjusted return ratios (Sharpe

Arbitrage Detector [LuxAlgo]The Arbitrage Detector unveils hidden spreads in the crypto and forex markets. It compares the same asset on the main crypto exchanges and forex brokers and displays both prices and volumes on a dashboard, as well as the maximum spread detected on a histogram divided by four user-selected percenti

Multi-Distribution Volume Profile (Zeiierman)█ Overview
Multi-Distribution Volume Profile (Zeiierman) is a flexible, structure-first volume profile tool that lets you reshape how volume is distributed across price, from classic uniform profiles to advanced statistical curves like Gaussian, Lognormal, Student-t, and more.
Instead of forcin

Multi-Ticker Anchored CandlesMulti-Ticker Anchored Candles (MTAC) is a simple tool for overlaying up to 3 tickers onto the same chart. This is achieved by interpreting each symbol's OHLC data as percentages, then plotting their candle points relative to the main chart's open. This allows for a simple comparison of tickers to tr

Vdubus Divergence Wave Pattern Generator V1The Vdubus Divergence Wave Theory
10 years in the making & now finally thanks to AI I have attempted to put my Trading strategy & logic into a visual representation of how I analyse and project market using Core price action & MacD. Enjoy :)
A Proprietary Structural & Momentum Confluence System

Per Bak Self-Organized CriticalityTL;DR: This indicator measures market fragility. It measures the system's vulnerability to cascade failures and phase transitions. I've added four independent stress vectors: tail risk, volatility regime, credit stress, and positioning extremes. This allows us to quantify how susceptible markets are

Volatility Risk PremiumTHE INSURANCE PREMIUM OF THE STOCK MARKET
Every day, millions of investors face a fundamental question that has puzzled economists for decades: how much should protection against market crashes cost? The answer lies in a phenomenon called the Volatility Risk Premium, and understanding it may fundam

Volume Gaps & Imbalances (Zeiierman)█ Overview
Volume Gaps & Imbalances (Zeiierman) is an advanced market-structure and order-flow visualizer that maps where the market traded, where it did not, and how buyer-vs-seller pressure accumulated across the entire price range.
The core of the indicator is a price-by-price volume prof

Match Finder [theUltimator5]Match Finder is the dating app of indicators. It takes your current ticker and finds the most compatible match over a recent time period. The match may not be Mr. right, but it is Mr. right now. It doesn't forecast future connection, but it tells you current compatibility for today.
Jokes aside,

See all indicators and strategies
Community trends
Netflix Stock Dives as Crowds Reach for the Remote: Binge Over?Netflix NASDAQ:NFLX investors who hit play heading into the earnings were expecting a feel-good episode. Instead, they got a cliffhanger — and not the good kind.
Shares of the streaming giant are lower by about 5% pre-market Wednesday, even after the company posted better-than-expected fourth-qu
MsftI think we pullback to 423 or 395 in the next weeks.
Monthly chart (Logarithmic)
Large rising wedge here.
Currently the monthly 20sma is around 447, if we close this week beneath that number then I expect a drop to 423 gap support will come next .
Too many bearish patterns playing out here..

$AVGO — My $360 stop held again, and this isn’t random.Price is forming a head-and-shoulders after an overshoot of the upper parallel channel. Historically, this combination has a bearish skew, with a around 70% probability of resolving lower.
If the pattern plays out, a move below $300 becomes a realistic scenario, with potential for (much) further do

META - SELLERS REMAIN IN CONTROLMETA W1 - Remains capped below the key weekly resistance at 711.00. As long as price fails to break and hold above the resistance level, selling pressure may resume, opening the door for a move toward 479.80 as the first downside target, followed by 393.73 if bearish momentum accelerates.
The over

Bank of America – Between Pressure and OpportunityIn the context of the declines recorded by the stock following the publication of financial results, the price has moved significantly closer to the support line of the ascending trend, trading below the 50-day moving average, while the RSI indicator signals a clear approach toward oversold territor

RKLB is heading down $78 first then $62 if we hold it we continue upward if not will see what happen after March earning.

NVDA 2026 back to original trendNVDA tend 2026: For April we can anticipate a downturn of 25% until reaching the range 130-140, and then for the end of the year a target price of 220-235!

Netflix, Inc. (NASDAQ: $NFLX) Set To Report Earnings TodayShares of Netflix, Inc. (NASDAQ: NASDAQ:NFLX ) are gearing for a breaking amidst earnings report today. The share price is set to break from a bullish rectangle pattern eyeing the $150 resistant zone.
Albeit down 0.06% in last recorded session, the stock is already up 0.66% as it gears for earning

$MSFT Microsoft Potential BUY/Support AreasNASDAQ (NQ) did not have a good start to the new year. It has been hitting lows after lows so far and yet to make a proper 2026 high. This downward correction is being reflected in nearly all major tech stocks.
MSFT (Microsoft) clearly created a double top while running inside and touching upper e

Mean Reversion Setup: META1. RSI in oversold region
2. Price likely to rebound back to the mean
Trade Rules:
Entry Trigger - RSI has cross below oversold region, enter limit buy at close price
Exit Trigger - Close at market when close price cross above exit trigger (Red Line)
Notes: Maximum of 3 open positions

See all stocks ideas
Jan 21
PLBCPlumas Bancorp
Actual
1.56
USD
Estimate
1.35
USD
Jan 21
TELTE Connectivity plc
Actual
2.72
USD
Estimate
2.55
USD
Jan 21
JNJJohnson & Johnson
Actual
2.46
USD
Estimate
2.46
USD
Jan 21
CFGCitizens Financial Group, Inc.
Actual
1.13
USD
Estimate
1.10
USD
Jan 21
TFCTruist Financial Corporation
Actual
1.00
USD
Estimate
1.09
USD
Jan 21
HALHalliburton Company
Actual
0.69
USD
Estimate
0.55
USD
Jan 21
BKUBankUnited, Inc.
Actual
0.90
USD
Estimate
0.89
USD
Jan 21
DCOMDime Community Bancshares, Inc.
Actual
0.79
USD
Estimate
0.71
USD
See more events
Today
RIKURiku Dining Group Ltd.
Exchange
NASDAQ
Offer price
4.00 - 6.00
USD
Today
BTGOBitGo Holdings Inc.
Exchange
NYSE
Offer price
15.00 - 17.00
USD
Tomorrow
E
EQPTEquipmentShare.com Inc.
Exchange
NASDAQ
Offer price
23.50 - 25.50
USD
Jan 29
P
PICSPicpay Holdings Netherlands BV
Exchange
NASDAQ
Offer price
16.00 - 19.00
USD
See more events
Community trends
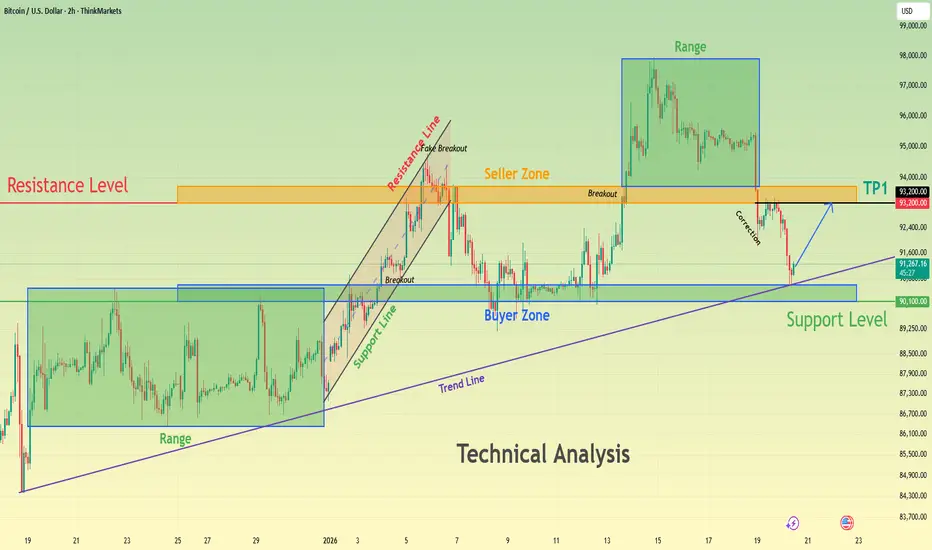
BTCUSD Holds Above Demand - Next Move Toward 93,200 ResistanceHello traders! Here’s my technical outlook on BTCUSD (2H) based on the current chart structure. Bitcoin is trading within a clear bullish environment after transitioning from a prolonged consolidation phase into an impulsive upward move. Earlier on the chart, price was moving inside a well-defined r
Bitcoin Hits PRZ — Short-Term Reversal in PlayBitcoin( BINANCE:BTCUSDT ), as I expected in the previous idea , continued its bearish trend and reached its target (full target).
Currently, Bitcoin is approaching a support zone ($90,590-$89,310) and is within the Potential Reversal Zone (PRZ) , near the Cumulative Long Liquidation Leverage($89

ETH Ascending Triangle: Long SetupEthereum is in an ascending structure, pulling back toward trendline support with clear resistance around 3,400 USD, offering a potential long setup with defined invalidation and targets.
Trade direction
- Long, buying the dip into the rising trendline / lower Bollinger area, aiming for another

Bitcoin Price Update – Clean & Clear ExplanationBitcoin highlighting a key pullback into a major demand zone after a strong bullish move BTC previously broke out strongly, rallying from the lower consolidation range to a local high near 97,500 after the rally, price entered a corrective phase, forming lower highs and lower lows the correction is

Bitcoin - The most important analysis you've ever seen!In this very detailed and unique analysis, we will look at the most important Bitcoin fundamental analysis of halving cycles. I predict Bitcoin will crash to 49k or 60k in 2026, so if you are buying now for the long term as an investment (buy and hold), you can probably wait for a better price! We c

ETHUSD CRACK! Wave 3 Warning!🚨When it rains, it pours. We’re seeing concurrent breakdowns across multiple asset classes, consistent with the risks I’ve been flagging for some time.
ETH is at stage 5️⃣ Panic / Liquidity Event, more on this later.
ETH is now down -47% from ATH, after Wave 1 down.
ETH has been trading below

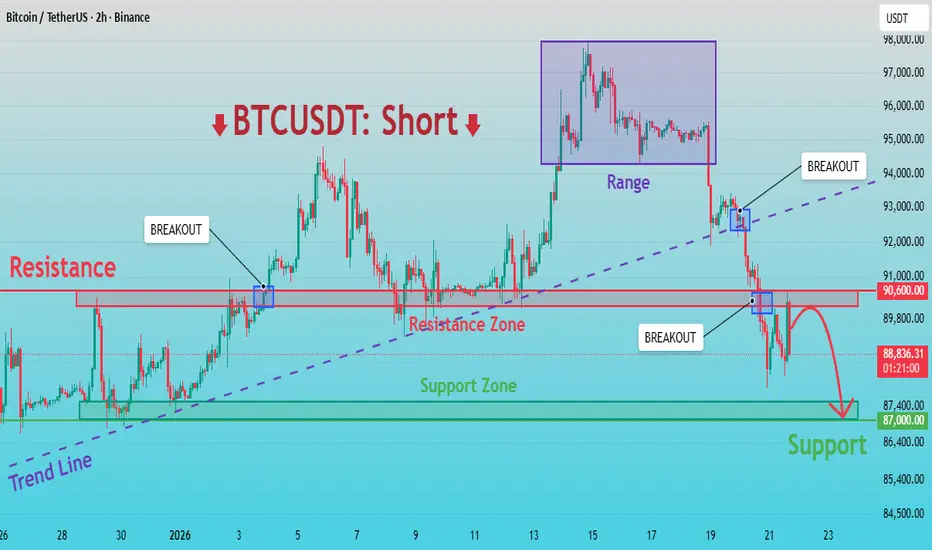
BTCUSDT: Breakdown Confirmed – Sellers in Control, Target to 87KHello everyone, here is my breakdown of the current BTCUSDT setup.
Market Analysis
BTCUSDT previously traded within a bullish structure, supported by a well-defined ascending trend line that reflected strong buyer control. After an impulsive upward move, price formed a consolidation range near th
BTCUSDT Long: Rising Trend Line and Demand Supports Bullish BiasHello traders! Here’s a clear technical breakdown of BTCUSDT (2H) based on the current chart structure. Bitcoin is trading within a developing bullish structure after forming a clear pivot low, from which a rising trend line has been established. This trend line reflects increasing buyer participati

Bitcoin in the phase of buyer liquidation...Consolidation after the rally. Above 94,250, a base was formed by buyers, but after the support broke, buyers were liquidated and are now closing their positions, thereby accelerating the downward rally.
Bullish volumes are declining, support for the cryptocurrency market is weakening, and the fund

AAVEUSDT - Bear market. Breakdown of support at 162.0BINANCE:AAVEUSDT is testing the support of the range amid a market decline. Bulls are reversing their positions due to weakening fundamentals. Focus on support at 162.0
Bitcoin is falling due to the deterioration of the fundamental background. The altcoin market is reacting aggressively and en

See all crypto ideas
XAUUSD Long: Uptrend Holds as Price Respects Rising Trend LineHello traders! Here’s a clear technical breakdown of XAUUSD (1H) based on the current chart structure. Gold is trading within a well-defined bullish structure after forming a clear pivot low earlier on the chart. From this pivot point, a rising trend line has been established, highlighting consisten

Trendline Resistance SetupThis chart represents a detailed intraday analysis of gold prices, focusing on key levels and potential price movements for January 19, 2026. The chart highlights crucial support and resistance zones, trendline resistance, and expected price reactions at various levels. Key strategies include waitin

Gold - Trump is crashing metals soon!🥊Gold ( OANDA:XAUUSD ) is retesting major resistance now:
🔎Analysis summary:
Yes, Gold has been creating an insane rally of 190% over the past couple of months. And so far, Gold also remains totally bullish. But looking at the higher timeframes, Gold is now sitting at a massive resistance tre

GOLD - Aggressive bullish trend. Test of the 4725 zone...FX:XAUUSD continues to update its historical maximum, currently testing the 4725 zone, against the backdrop of escalating geopolitical risks and declining risk appetite...
Fundamental situation
Trump's threats to impose new tariffs on goods from the EU and the union's retaliatory measures ha

Gold was moving in a sideways range lets see what next ?Gold remains in a bullish consolidation phase after hitting a new record high near the 4700 mark for the first time. The rally was supported by a weaker U.S. dollar and fears of renewed trade tensions, which sparked a strong rush into safe-haven assets.
Markets are now awaiting the European respons

(XAUUSD) Gold Bullish Trend With Expected Bearish CorrectionPrice is trading inside a bullish ascending channel after a strong break of structure.
Previous resistance has flipped into demand, confirming bullish continuation. Expecting price to seek buy-side liquidity above the highs, with a corrective pullback toward the demand flip zone before continuation

Gold 30-Min — Volume Buy Reversal Triggered⚡Base : Hanzo Trading Alpha Algorithm
The algorithm calculates volatility displacement vs liquidity recovery, identifying where probability meets imbalance.
It trades only where precision, volume, and manipulation intersect —only logic.
Technical Reasons
/ Direction — LONG / Reversal 4760 Area
☄️B

XAUUSD H1 – Bullish Structure Holds After Early-Week GapHello, I’m Louna.
From the H1 perspective, XAUUSD continues to trade cleanly within a well-defined ascending channel, confirming that the broader bullish market structure remains intact. Price is still printing higher highs and higher lows, a clear sign that buyers are firmly in control of the domi

Lingrid | GOLD Approaching Most Significant Level in HistoryOANDA:XAUUSD perfectly played out my previous trading idea . The market is pressing into the upper boundary of its long-term ascending channel as price nears the psychological 5,000 zone, an area that aligns with major historical resistance. It continues to respect its rising channel structure, wi

Gold near $5,000 — this is where bull markets turn parabolic🚨 As we are closing in 5,000 USD in gold prices, the bull market is entering its parabolic stage. Let’s review the current bull market stats + historic bull markets in more detail. Let’s go.
________________________________________
✅ Executive Summary — Top 10 Key Takeaways
1.🟡 Gold just printe

See all futures ideas
EURUSD: A Pullback to 1.1680 is Planned Before Further GrowthHello everyone, here is my breakdown of the current EURUSD setup.
Market Analysis
EURUSD previously traded within a well-defined upward channel, confirming a bullish recovery phase with higher highs and higher lows. During this advance, price respected the rising support line and produced several

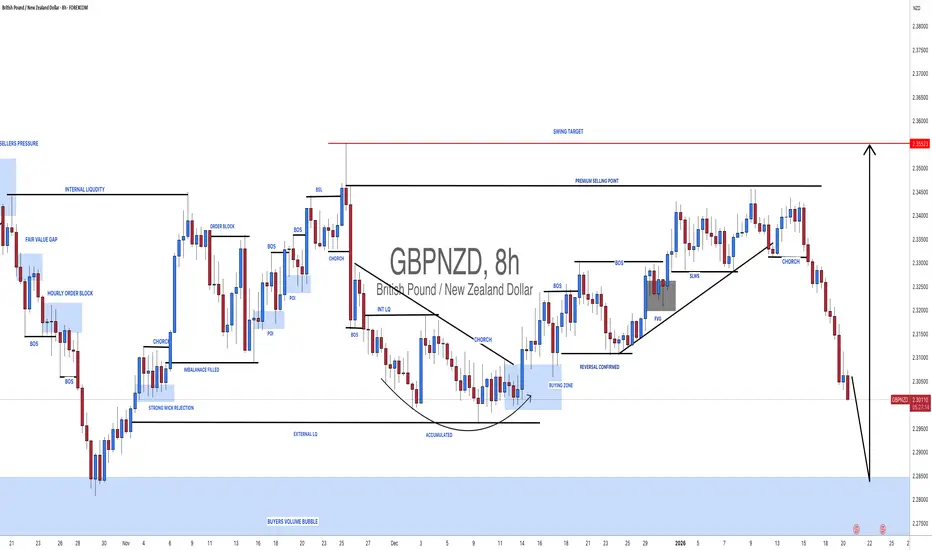
GBPNZD: One Swing Entry With One Swing TargetDear Traders,
I hope you’re doing well. We have a fantastic opportunity coming up where the price could move up in an impulse pattern. This trading setup requires just one entry and one swing target but you might also consider using intraday take profit zones.
Like and comment on this post, also
EURUSDHello Traders! 👋
What are your thoughts on EURUSD?
After a correction, price reached a key support zone and the ascending trendline, where it found strong buying interest. We are now witnessing a clear breakout of the descending trendline, confirming a shift in short-term market structure and a su

21.01.26 Daily ForecastPairs on Watch -
FX:NZDJPY
FX:EURUSD
A short overview of the instruments I am looking at for today, multi-timeframe analysis down to what I will be looking at for an entry. Enjoy!

NZDUSD Breakout and Potential Retrace!Hey Traders, in today's trading session we are monitoring NZDUSD for a buying opportunity around 0.58200 zone, NZDUSD was trading in a downtrend and successfully managed to break it out. Currently is in a correction phase in which it is approaching the retrace area at 0.58200 support and resistance

GBPJPY: Bulls in Full ControlHello traders,
GBPJPY is presenting a clearly bullish picture, where macroeconomic factors and technical structure are working in alignment rather than against each other.
From a fundamental perspective, the Japanese yen continues to face downside pressure following news of a potential early el

TheGrove | CHFJPY Sell | Idea Trading AnalysisYou can expect a reaction in the direction of selling from the specified Resistance zone,
CHFJPY moving higher as it tests the strong resistance level..
We expect a bearish move from the confluence zone.
Hello Traders, here is the full analysis.
I think we can soon see more fall from this range! GO

EURUSD Pullback Underway – Will 1.1700 Hold the Trend?EURUSD Pullback Underway – Will 1.1700 Hold the Trend?
Following Trump's comments on tariffs and Greenland, the high liquidity of the US dollar created unexpected weakness in it.
The price is currently correcting after the aggressive upward moves we had yesterday.
However, volatility is high gi

EURUSD Can Push HigherPrice has been pushing higher after breaking the trendline, with very little resistance. Notice how it just breaks above: the move is impulsive and committed.
We then see price pauses and forms a small bull flag. This is not weakness, it’s a pause, it lack follow-through to the downside. There’s no

AUDUSD - NEW BREAKOUT!Hello traders,
the AUDUSD has broken the resistance level (0.67666 – 0.67524).
This key zone now acts as new support,
so I expect a bullish move from here.
🎯 TARGET: 0.68100

See all forex ideas
| - | - | - | - | - | - | - | ||
| - | - | - | - | - | - | - | ||
| - | - | - | - | - | - | - | ||
| - | - | - | - | - | - | - | ||
| - | - | - | - | - | - | - | ||
| - | - | - | - | - | - | - | ||
| - | - | - | - | - | - | - | ||
| - | - | - | - | - | - | - |
Trade directly on Supercharts through our supported, fully-verified, and user-reviewed brokers.