Organizational Chart Templates for Teams
Structural clarity is the backbone of operational efficiency. Miro’s professional organizational chart templates are more than just static diagrams; they are dynamic blueprints designed to solve the "silo effect" in scaling companies. From visualizing complex reporting lines to streamlining headcount planning, our collection of org chart templates provides the spatial canvas necessary for modern, agile leadership.
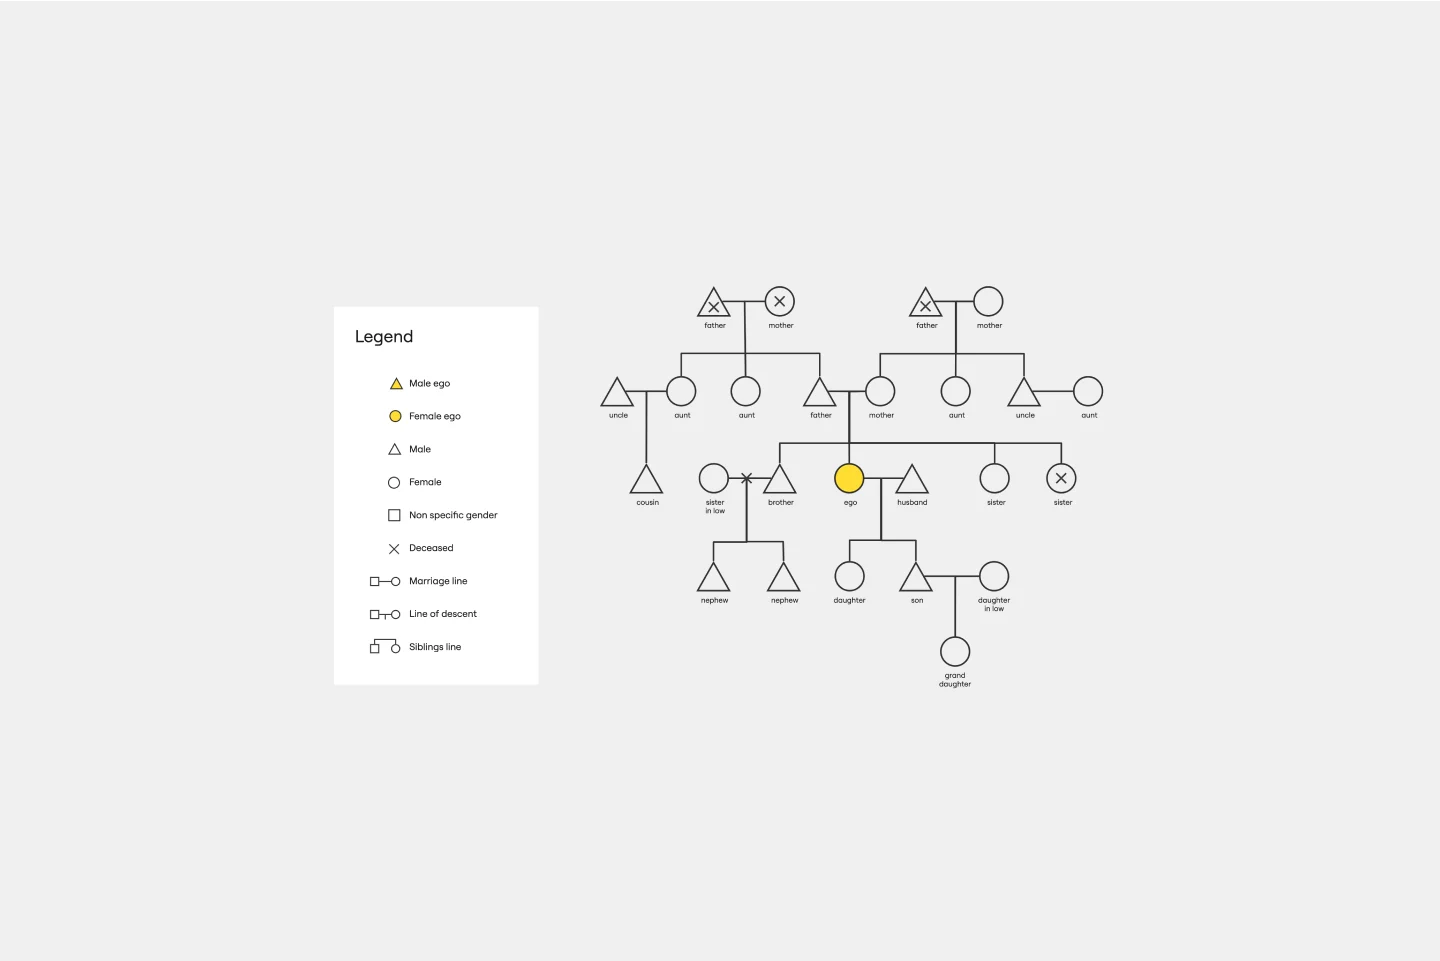
What is an Organizational Chart?
An organizational chart (or org chart) is a visual representation of a company's internal structure, detailing the roles, responsibilities, and relationships between entities. Beyond a simple hierarchy, modern org design uses these charts to map cross-functional dependencies and matrix reporting lines. By centralizing employee data into a visual format, organizations can improve transparency, simplify onboarding, and ensure every team member understands their place within the broader corporate strategy.
Essential Types of Organizational Charts
Choosing the right structure depends on your company’s communication flow and scale. Miro’s collection supports the four primary models used in modern business:
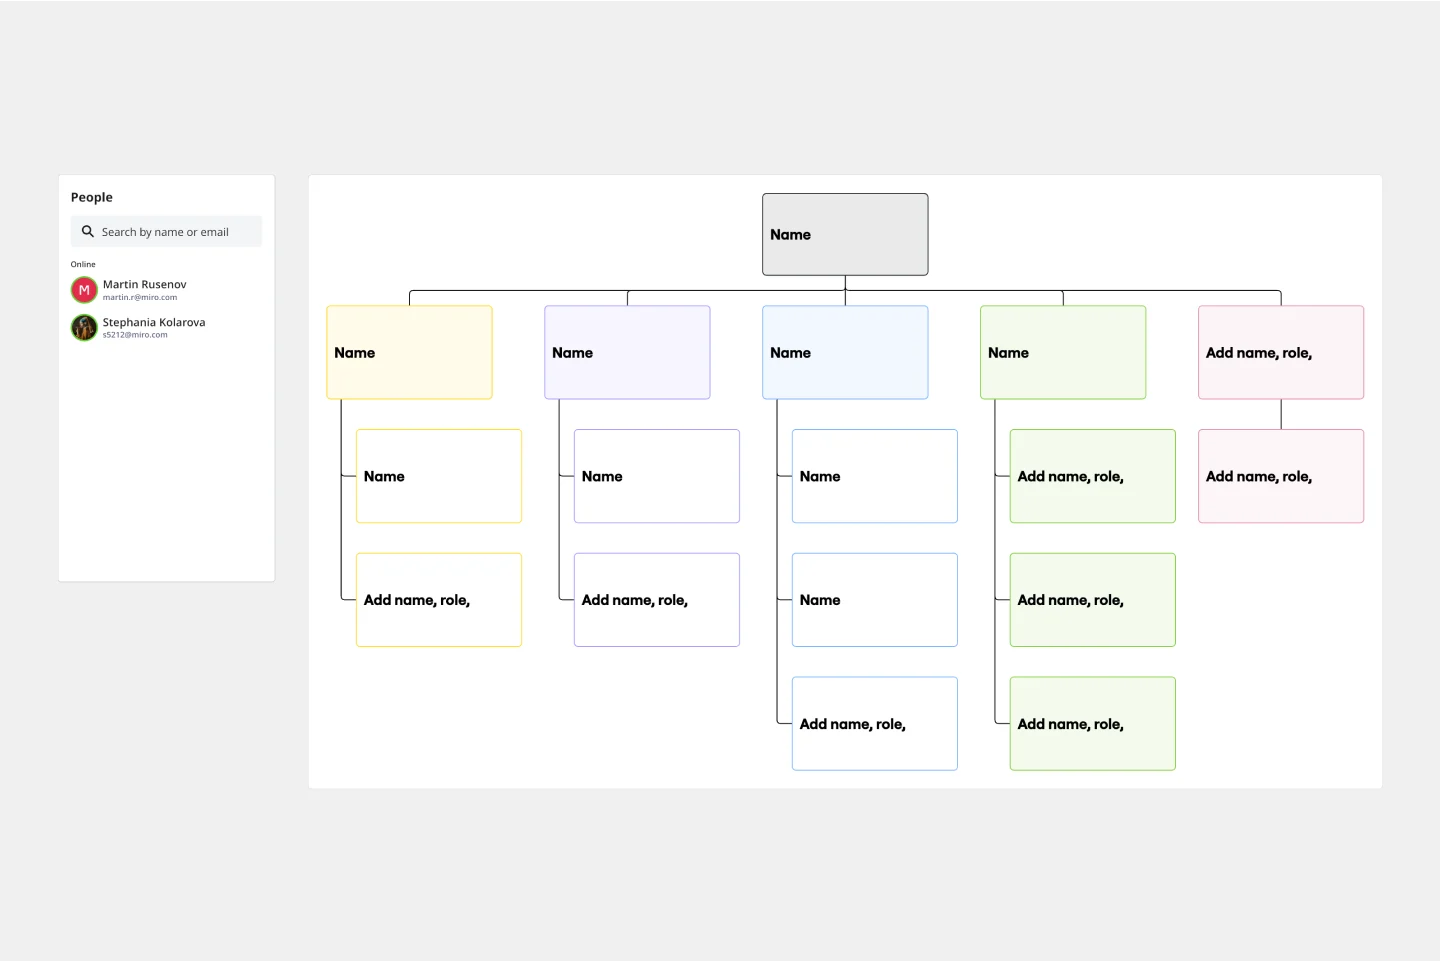
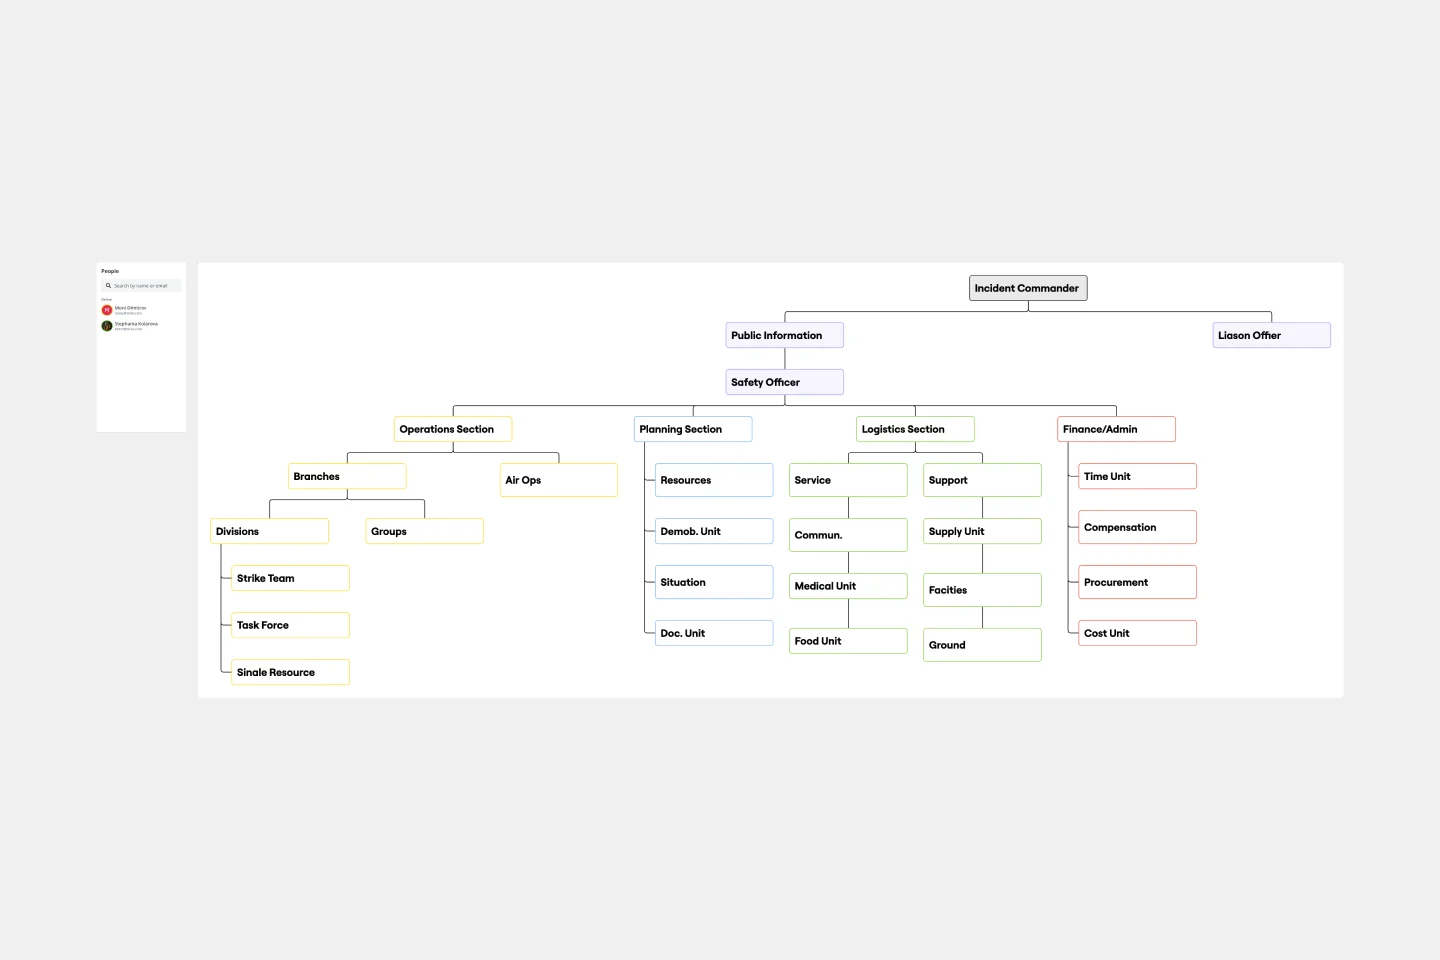
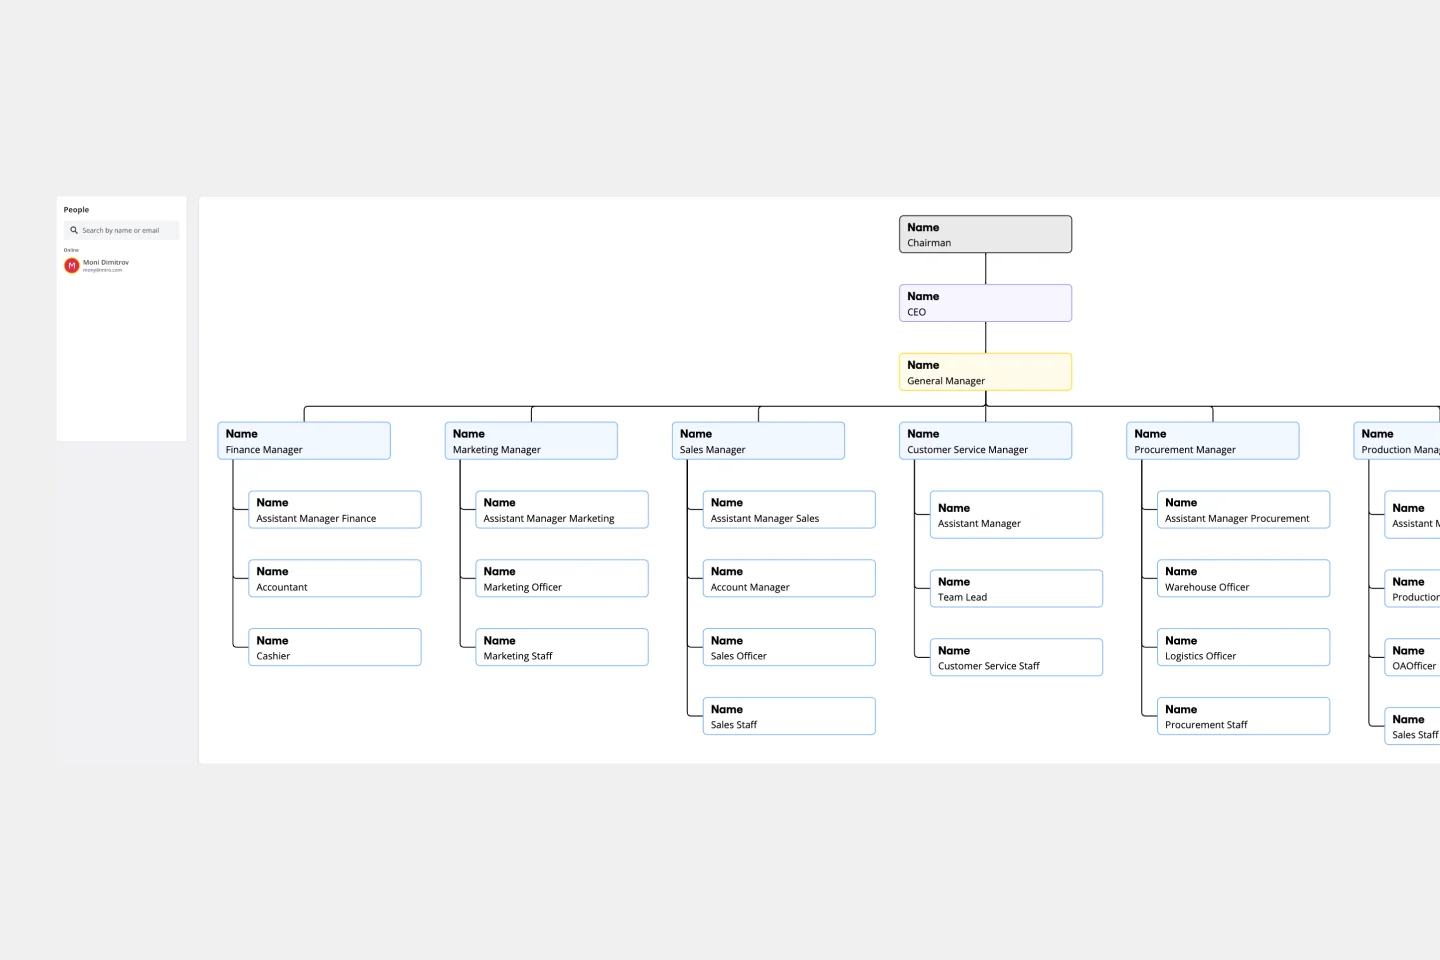
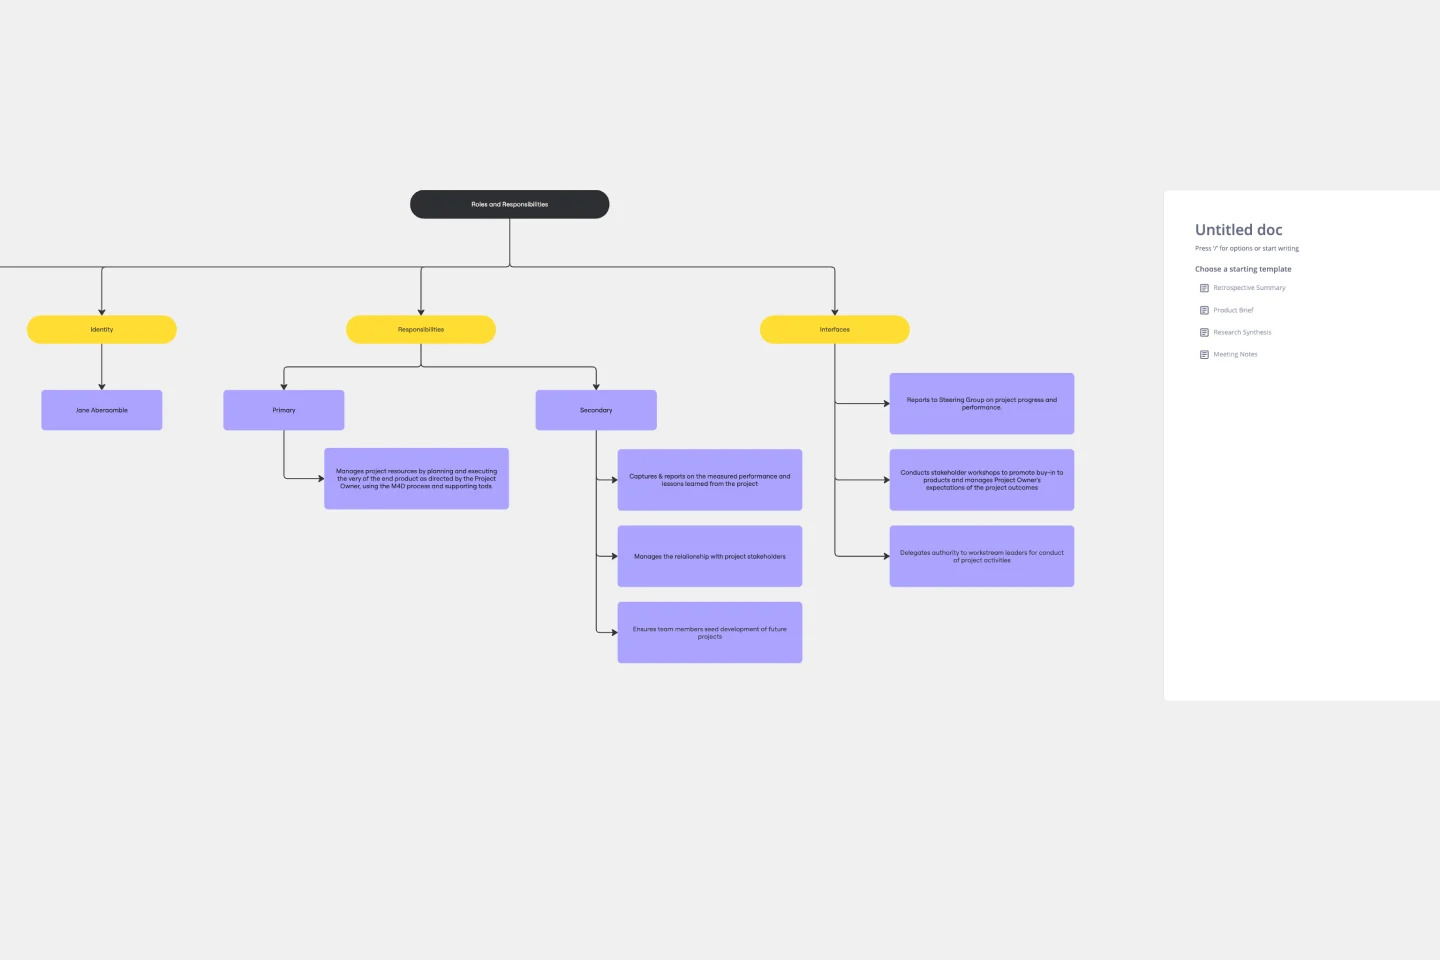
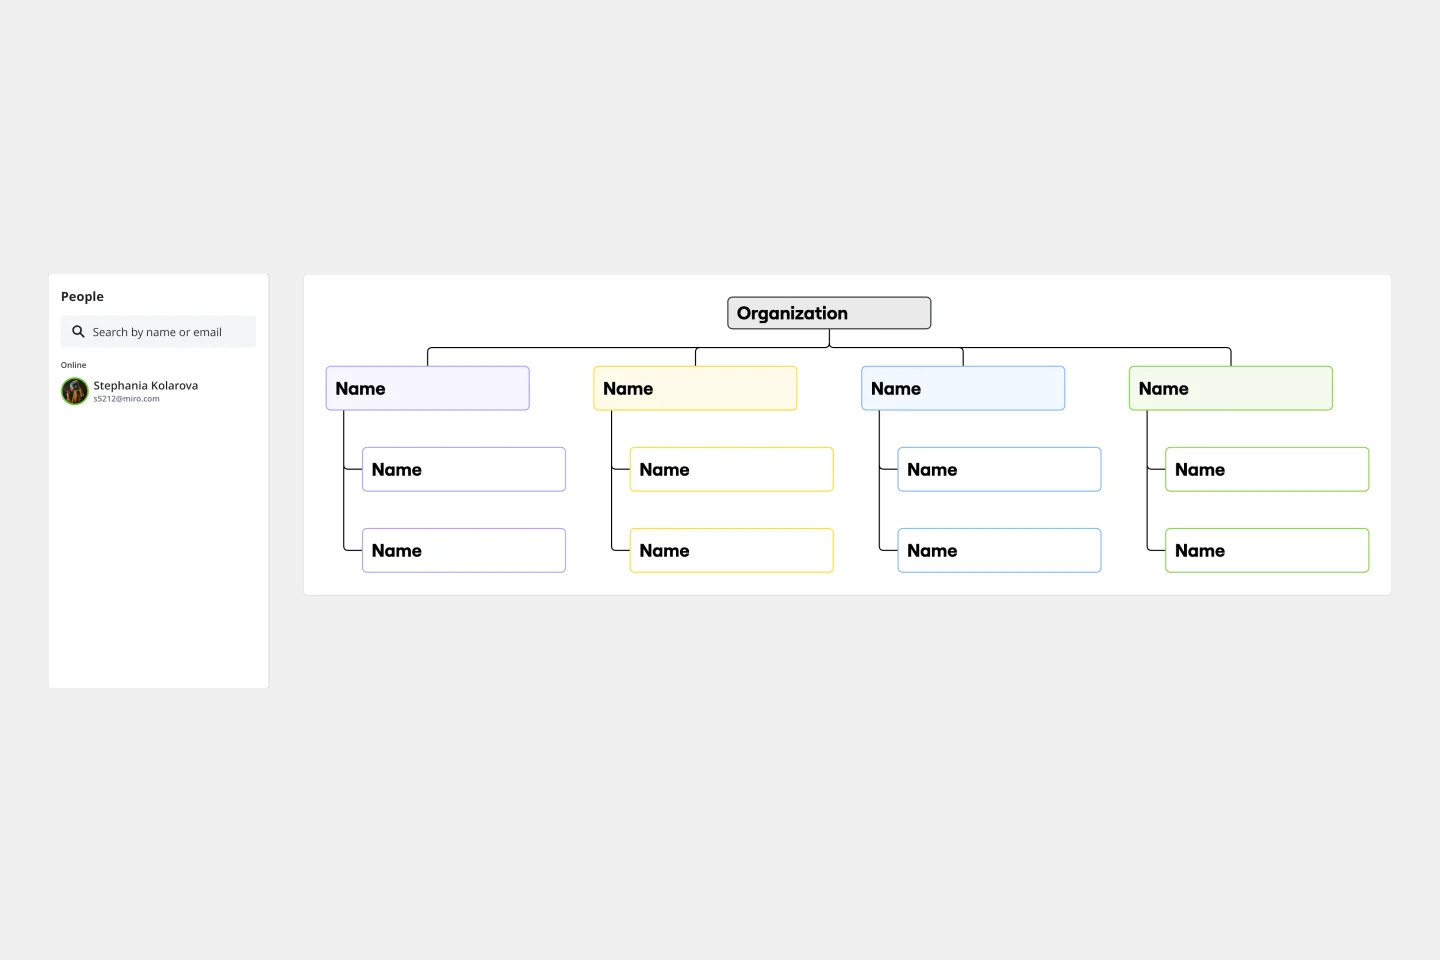
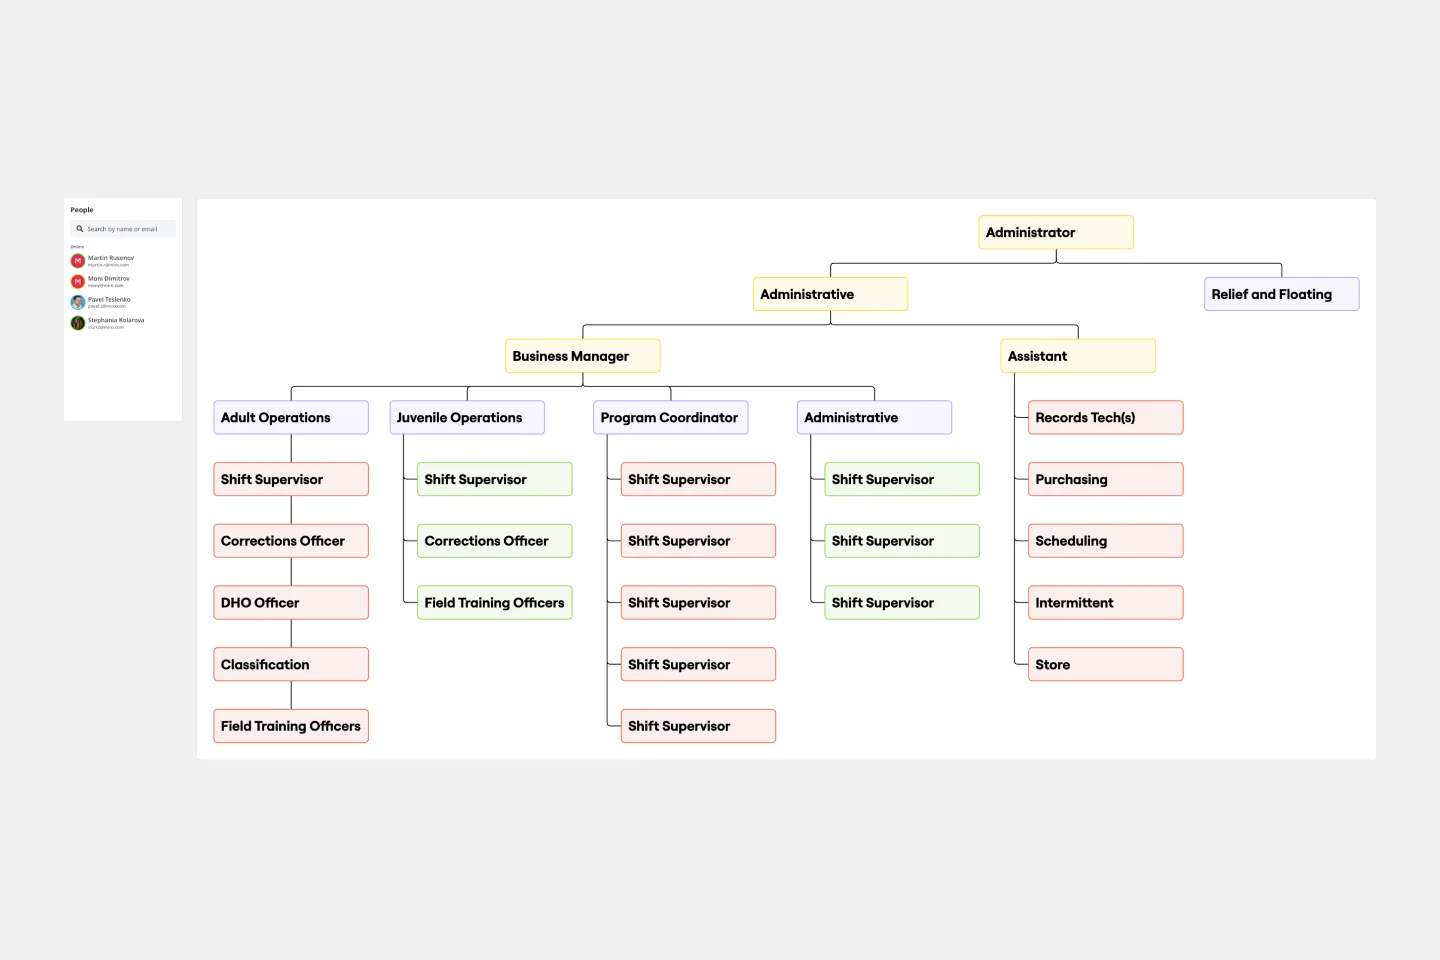
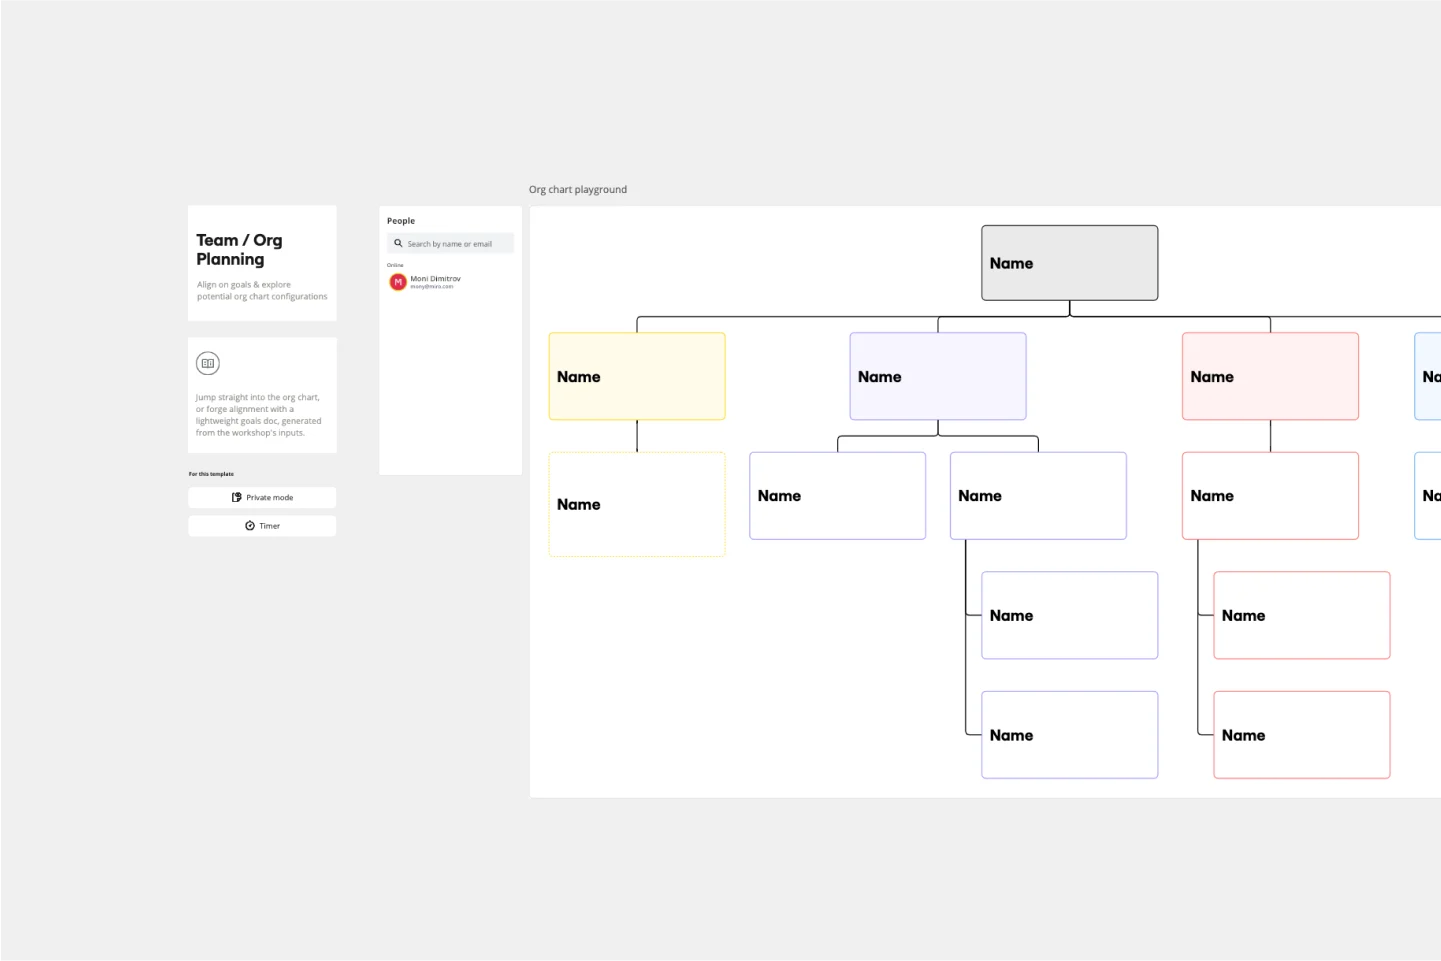
1. Hierarchical Org Chart (Top-Down)
The most common model, showing a clear chain of command from the CEO down to department leads and individual contributors.
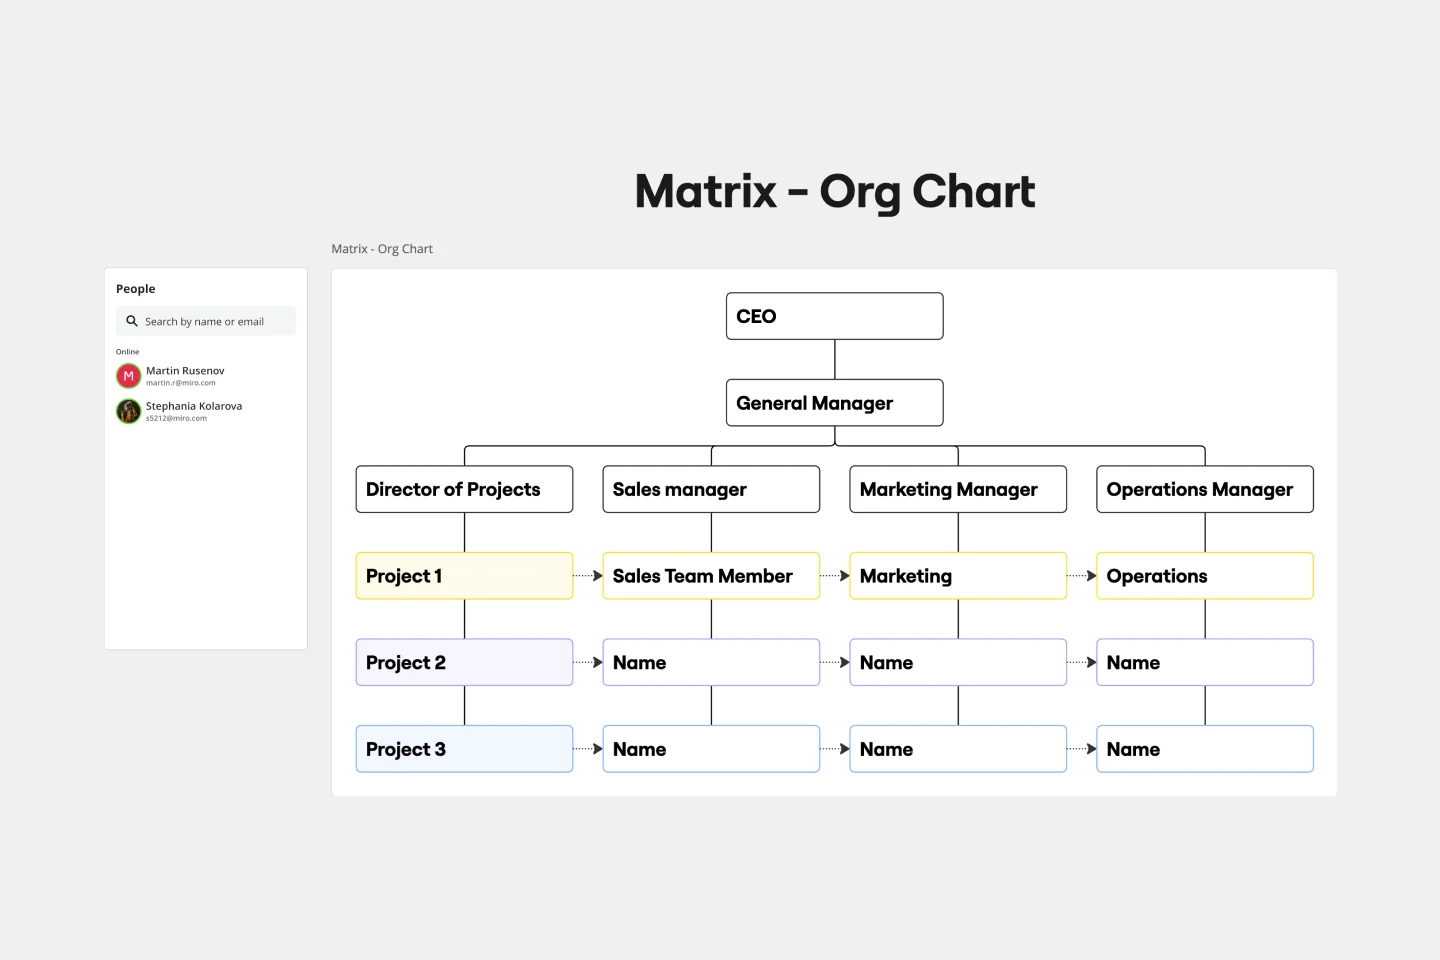
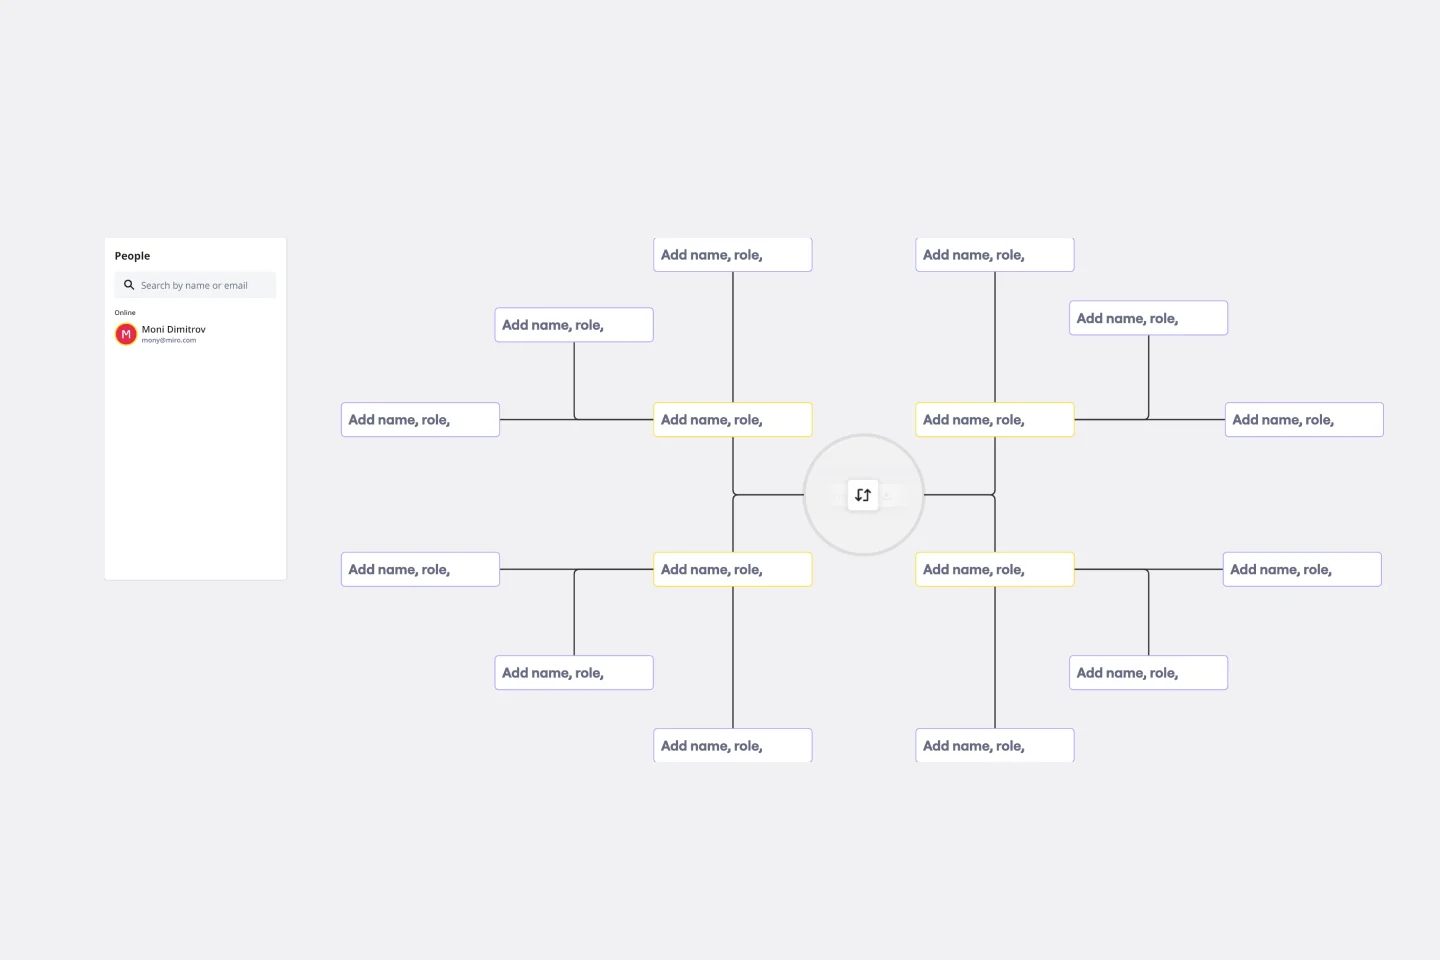
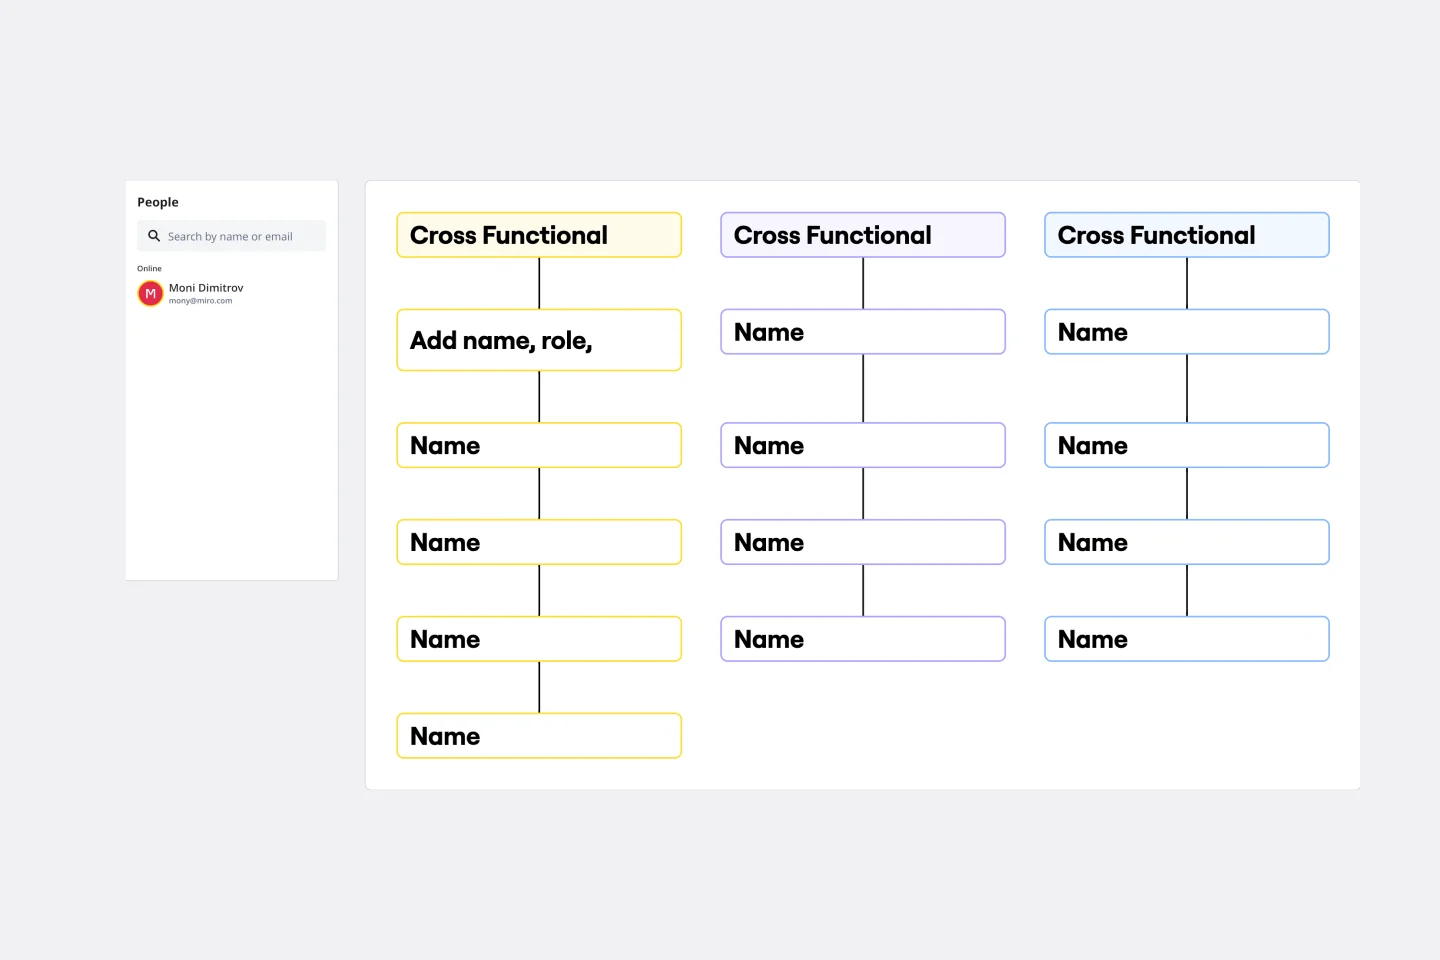
2. Matrix Org Chart
A complex structure where employees have dual reporting relationships—usually to both a functional manager and a product or project manager.
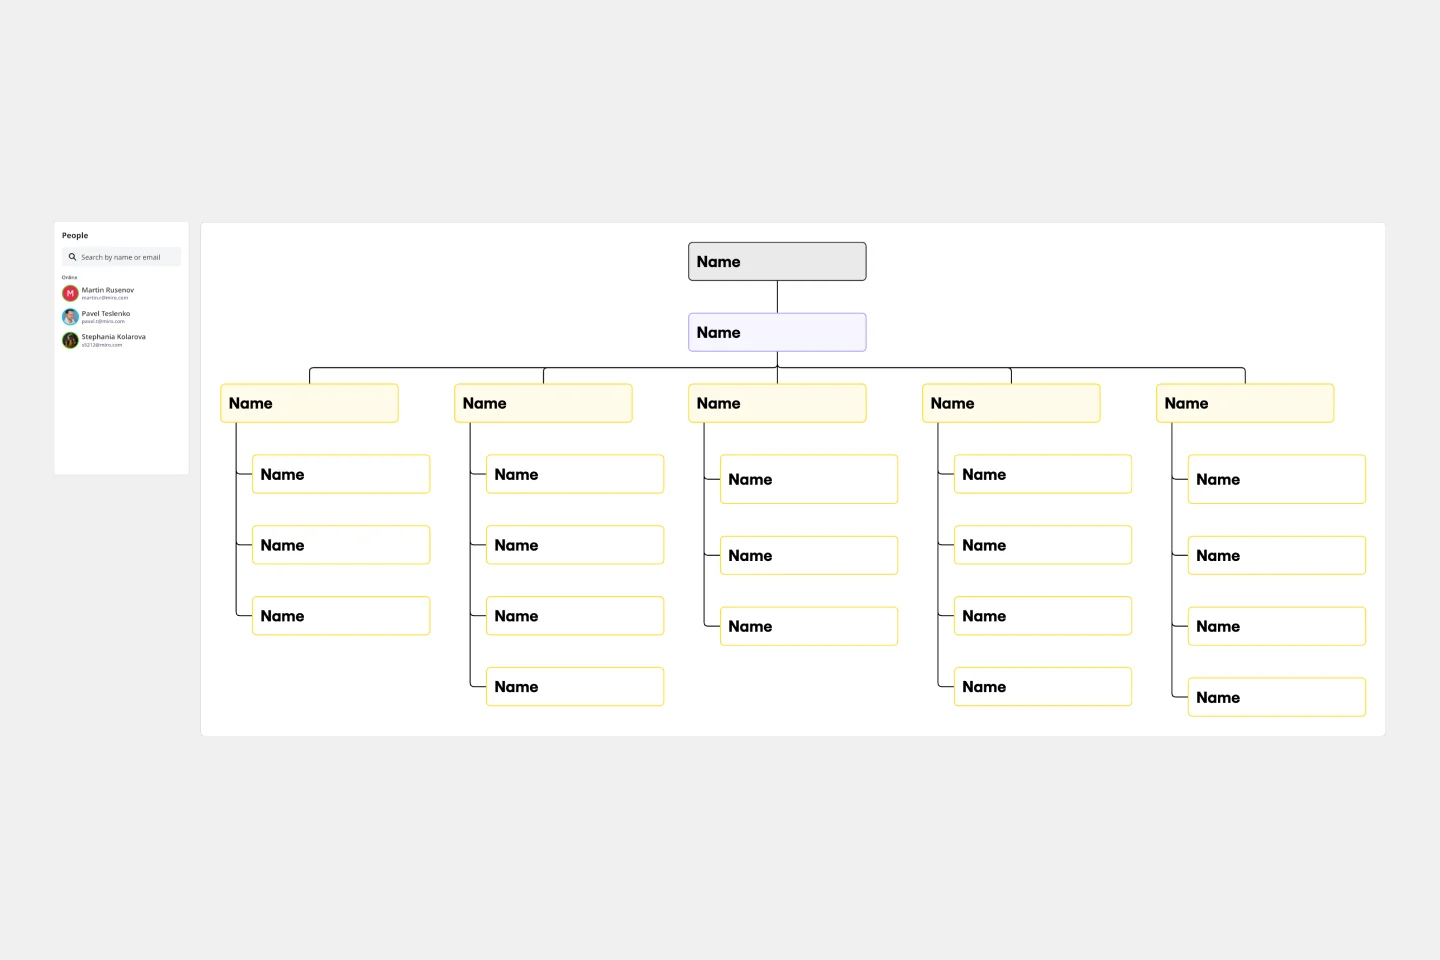
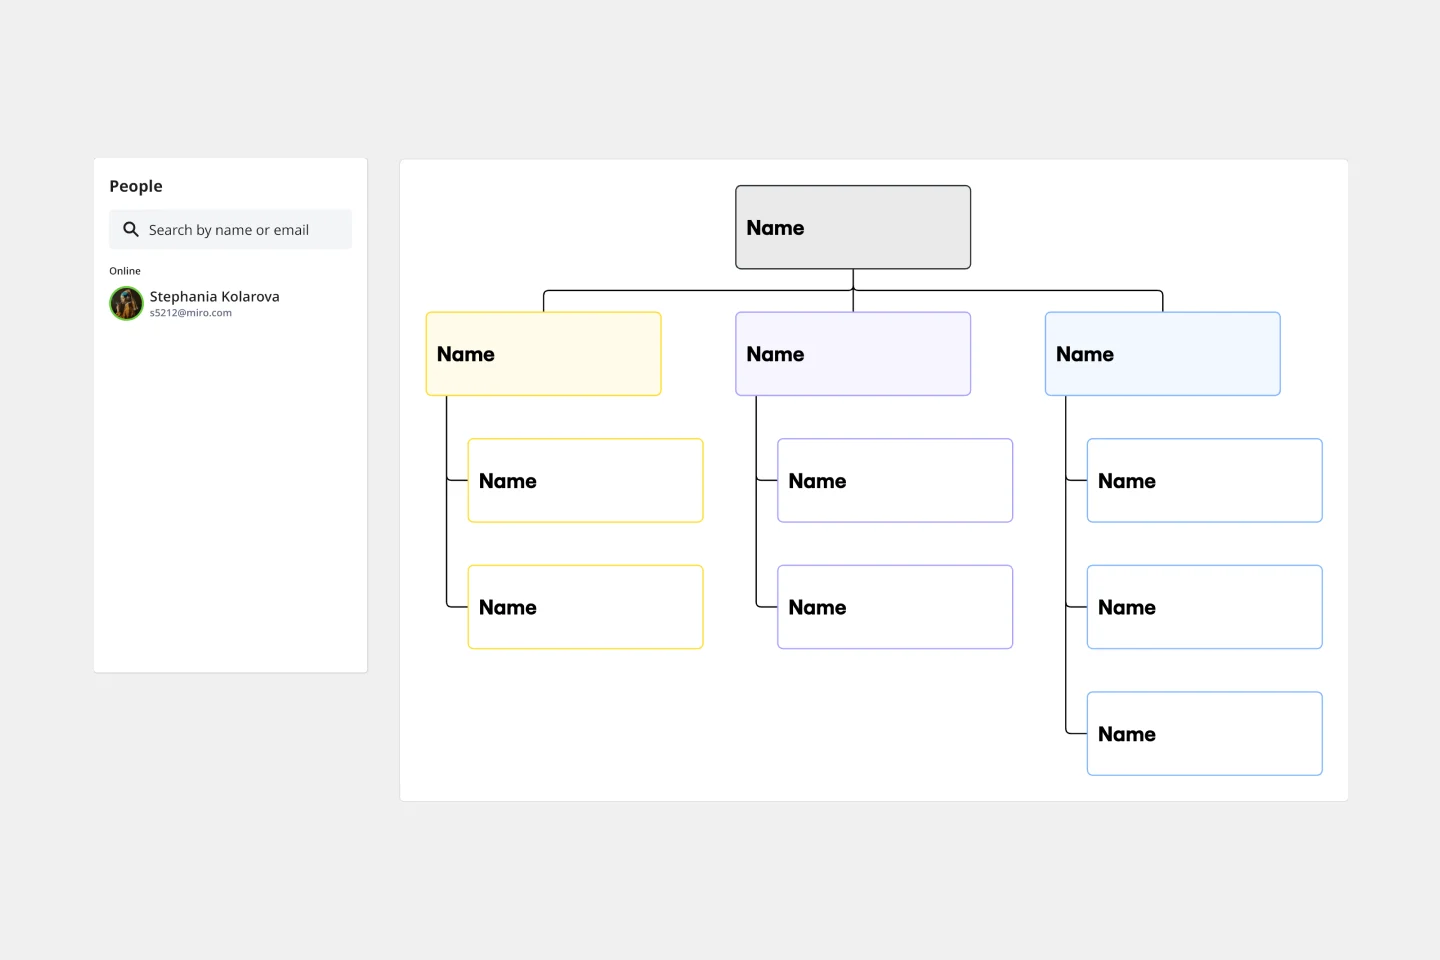
3. Flat (Horizontal) Org Chart
This model removes middle management layers, granting individual employees more autonomy and direct access to leadership.
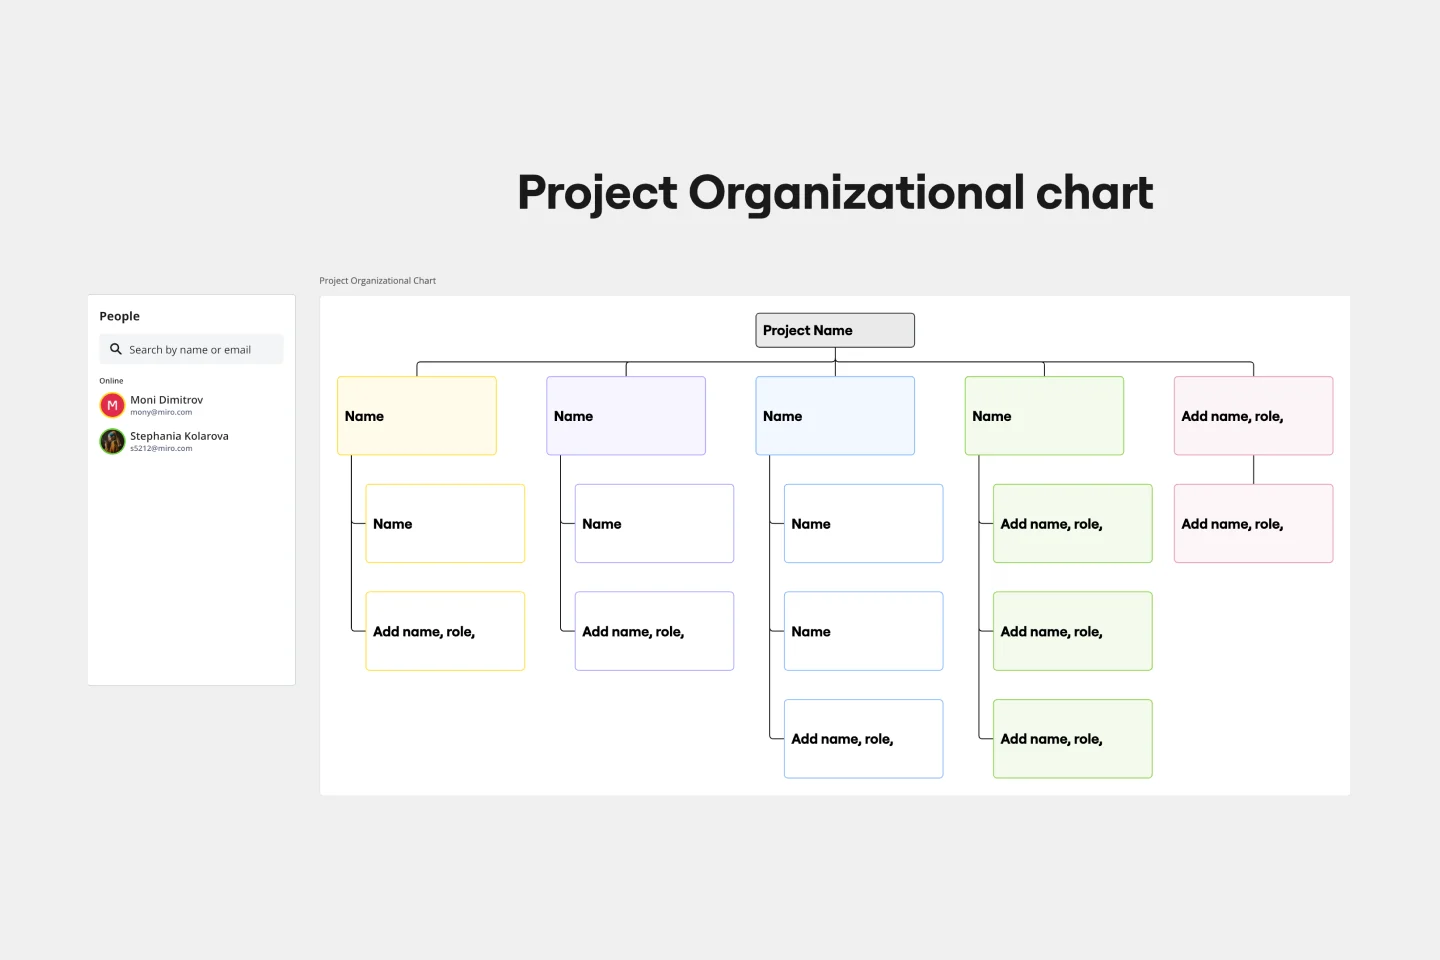
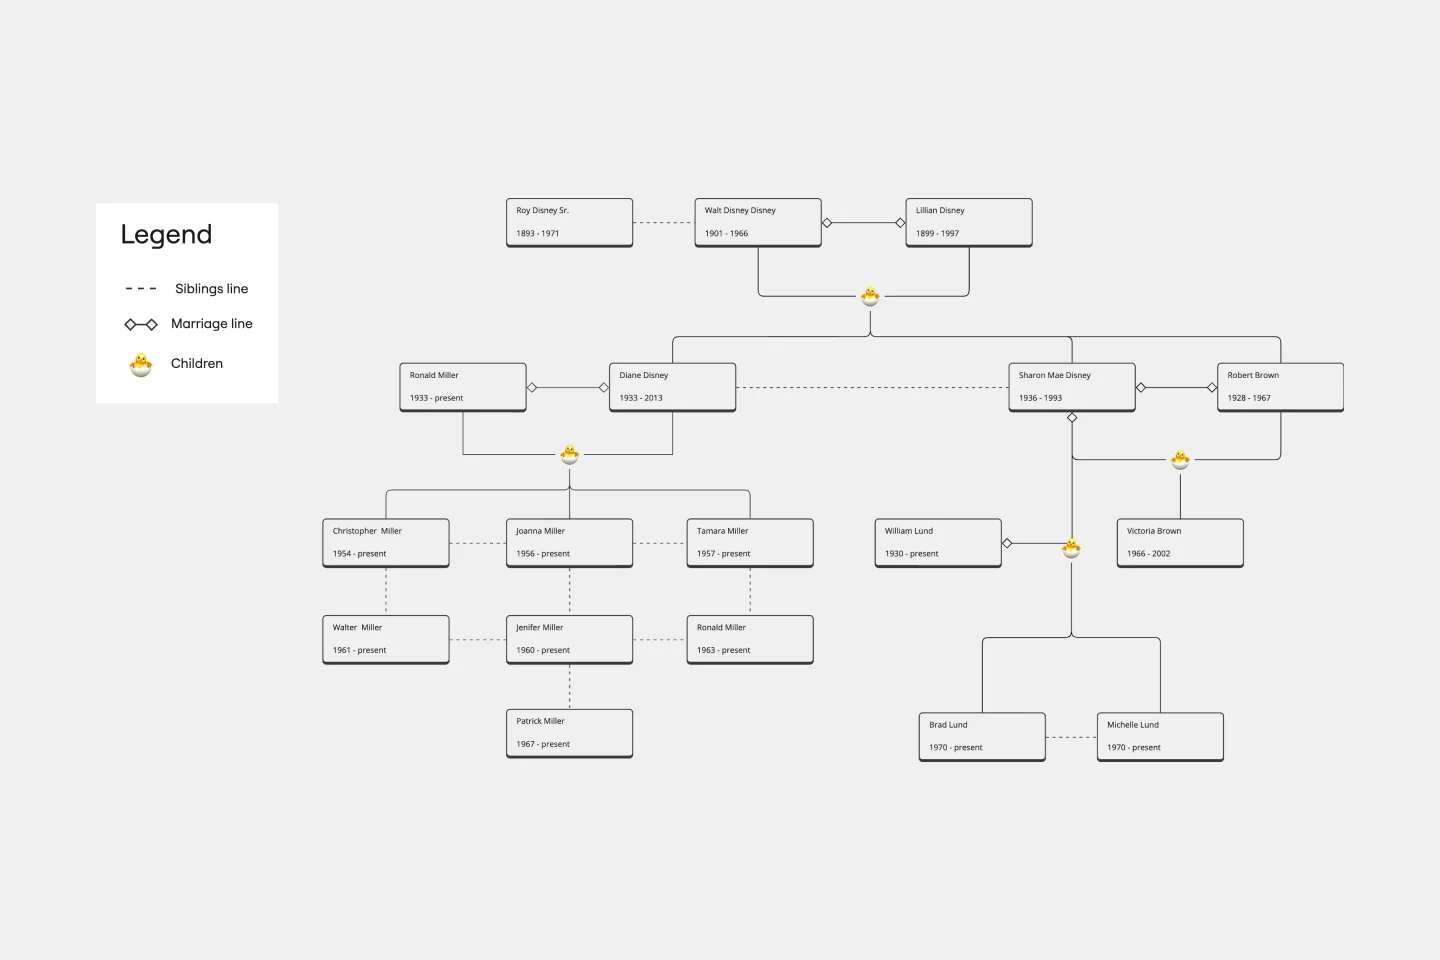
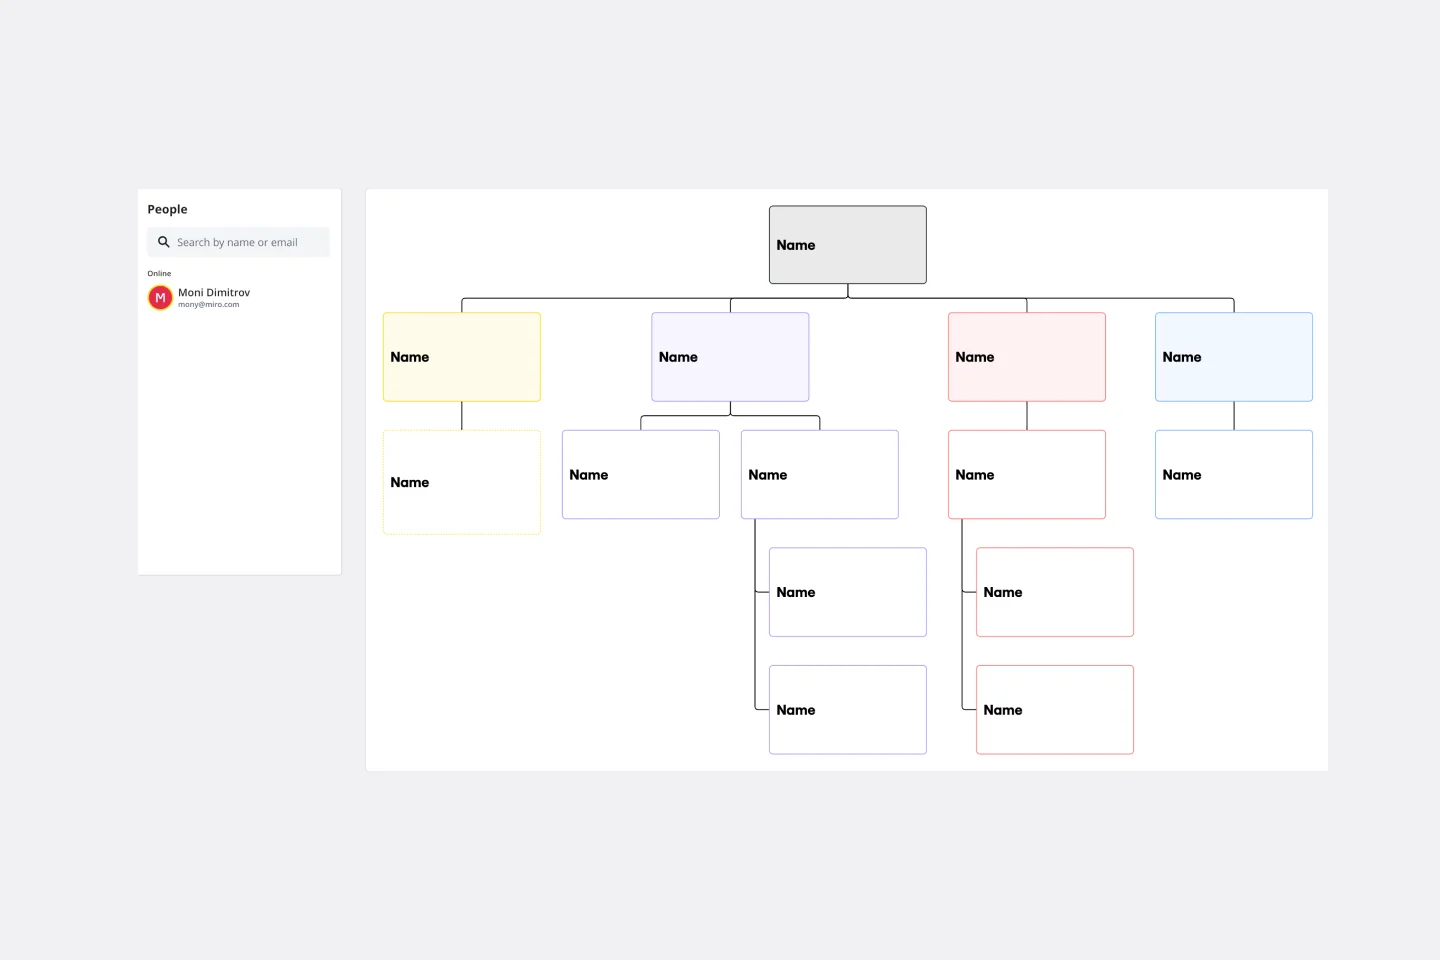
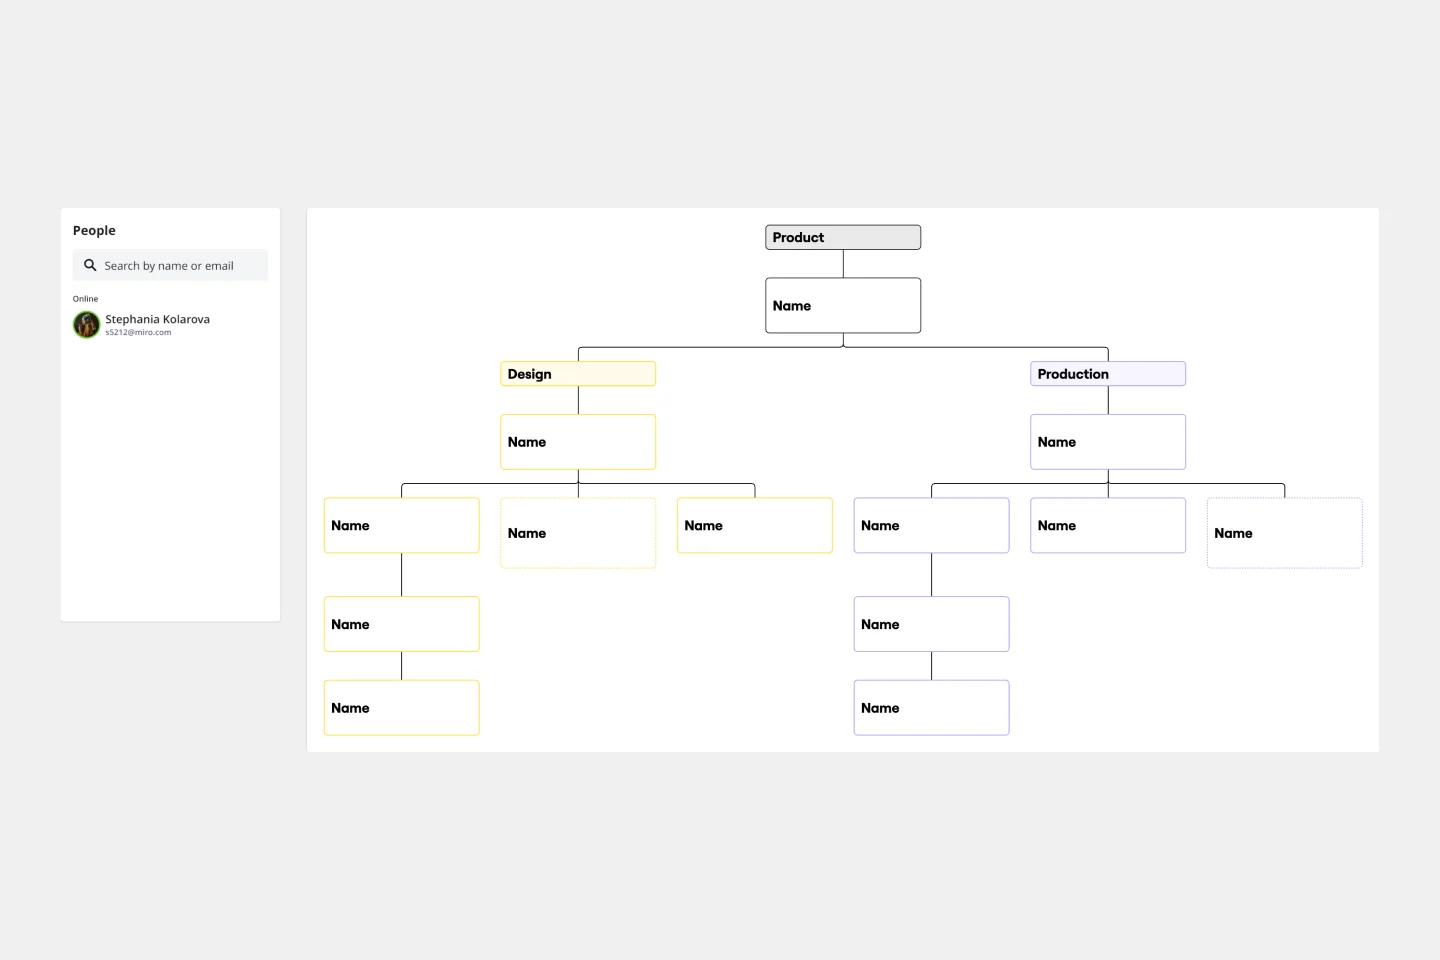
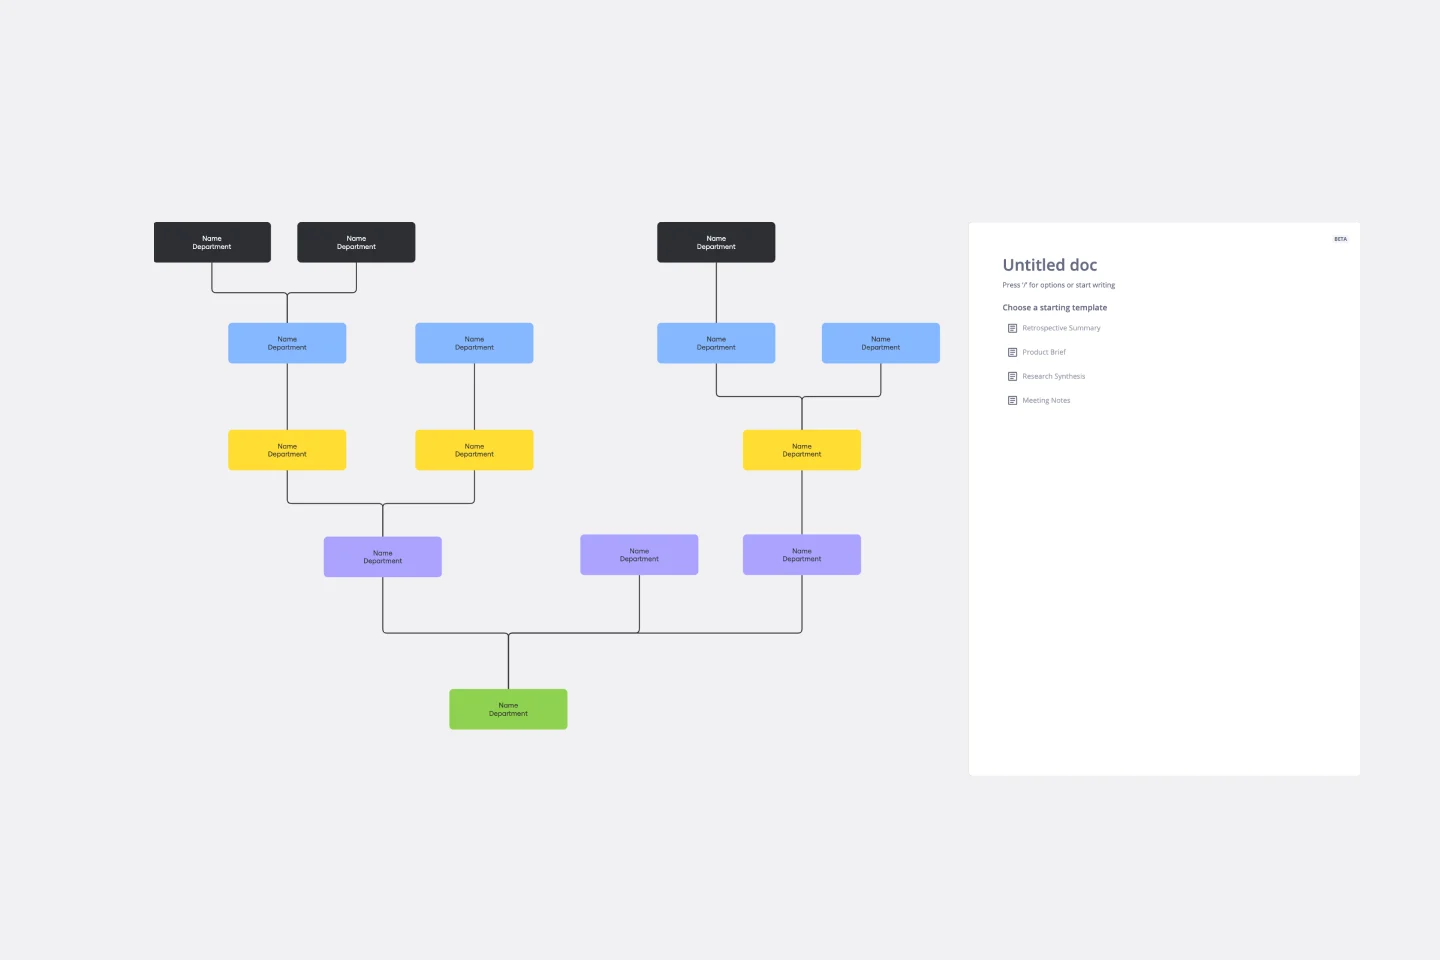
4. Divisional Org Chart
The organization is split into semi-autonomous units based on specific products, services, or geographical markets.
Why Strategic Leaders Choose Miro for Org Design
While basic tools offer boxes and lines, Miro provides a centralized source of truth for your people operations. Our organizational chart templates bridge the gap between high-level human capital management and daily team collaboration.
Automated Data-to-Chart Sync: Eliminate manual entry. Use our dedicated Org Chart Widget to bulk-import CSV data directly into your org chart templates, instantly transforming raw employee lists into structured hierarchies.
Dynamic Matrix Mapping: Unlike rigid PDFs, our templates allow you to visualize dotted-line relationships and matrix structures, reflecting how modern work actually happens.
Brand-Consistent Documentation: Maintain professional standards. Customize any of ourtemplates with your brand’s hex codes and typography to ensure internal documentation mirrors your corporate identity.
Real-Time Governance: Organizational changes happen in minutes. Multi-user editing allows HR and Department Heads to collaborate on "Future State" planning within our organizational design in a secure, shared environment.
How to Build Your Structure
Select a Framework: Choose from Hierarchical, Flat, or Matrix organizational chart templates.
Sync Your Data: Use the Org Chart Widget to automate accuracy across all templates.
Add Metadata: Layer in tags for skills or time zones to turn templates into resource management tools.
Export & Share: Present your vision to stakeholders or export your org chart templates as high-res PDFs for investor decks.
The Org Design Audit: 3 "Health Checks" for a Scalable Structure
To move your org chart from a "roster" to a Strategic Asset, apply these three expert filters to your Miro board:
1. The "Span of Control" Heatmap
The Audit: Look at your middle management layer. How many direct reports does each lead have? The Fix: Use color-coding to highlight managers with more than 7–8 direct reports. These are your "Burnout Zones." An authoritative org chart helps you visualize where you need to insert a new layer of leadership to maintain operational speed.
2. Identifying "Single Points of Failure"
The Audit: Look for "T-shaped" branches where a single person is the only link between two critical departments. The Fix: Use Miro’s Connection Lines to identify these bottlenecks. If one person is the sole owner of a vital dependency, your org chart has just revealed a significant business risk. Highlight these roles for urgent "Succession Planning" or "Cross-Training" initiatives.
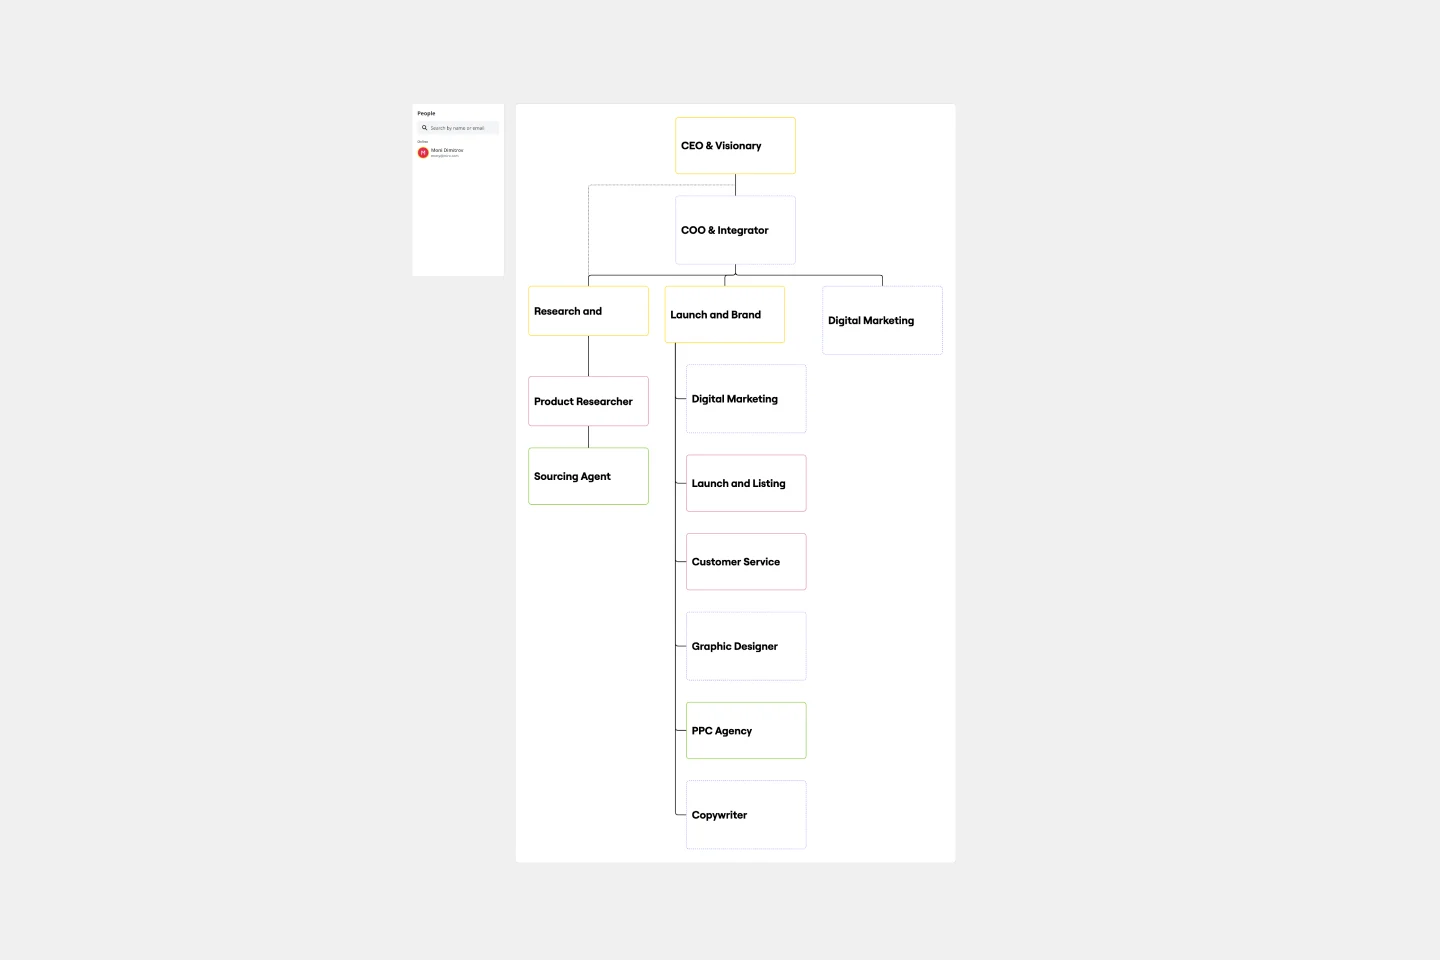
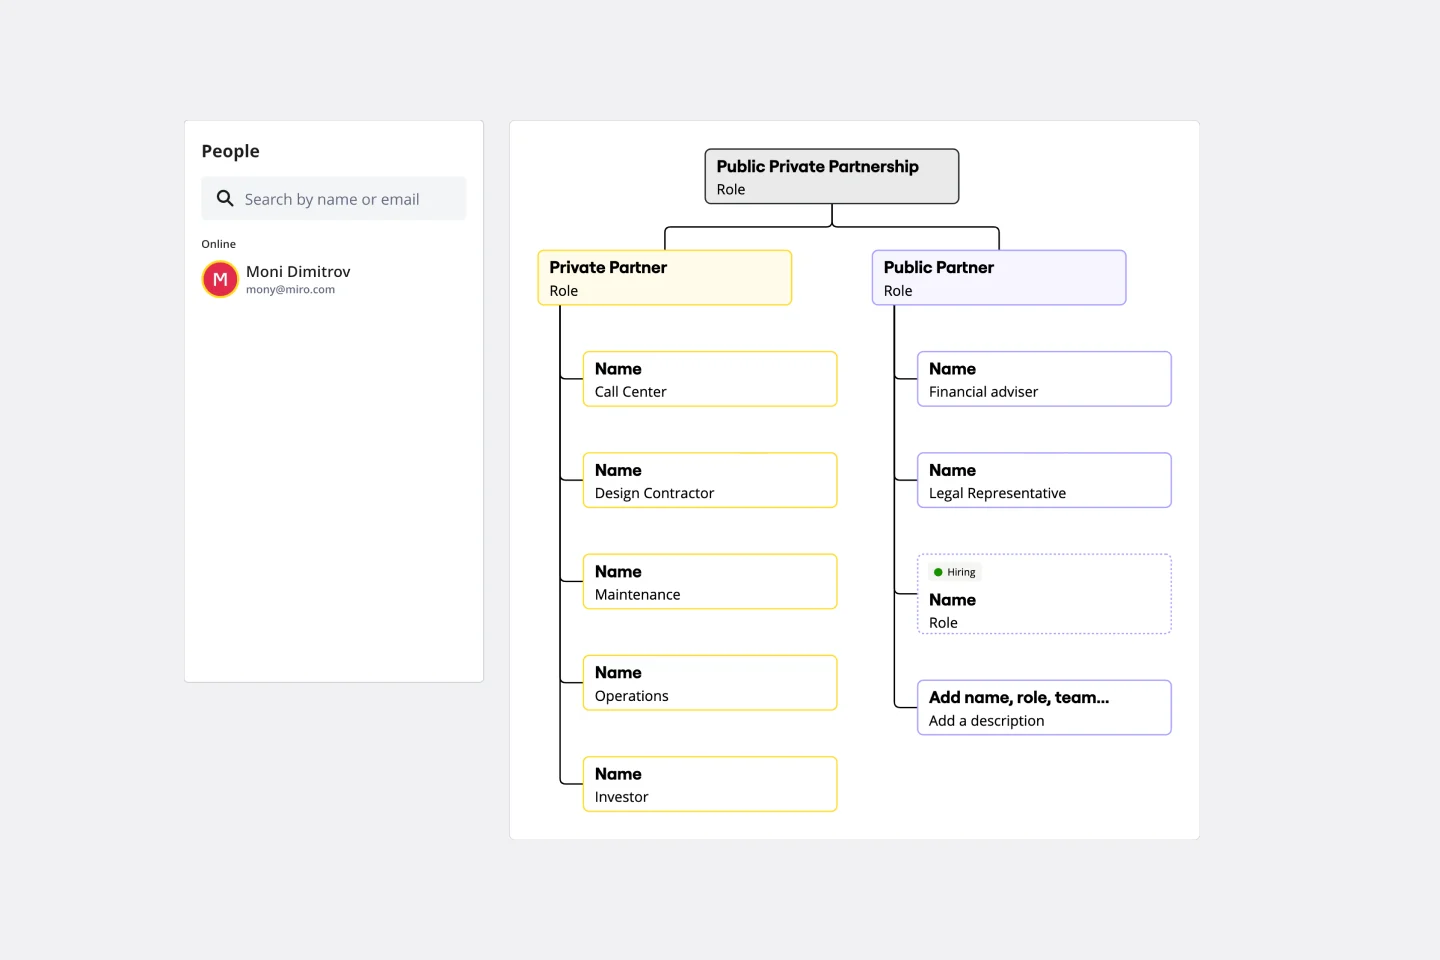
3. The "Ghost Role" Gap Analysis
The Audit: Does your chart only show who is in the building today? The Fix: An expert org chart includes your Hiring Roadmap. Use transparent or dashed-line boxes to represent unfilled positions required for next quarter's OKRs. This allows the team to see the "gap" between current capacity and future goals.
Try Miro's org chart creator now!