NIFTY KEY LEVELS FOR 19.01.2026NIFTY KEY LEVELS FOR 19.01.2026
Timeframe: 3 Minutes
Sorry for the Delayed post..
If the candle stays above the pivot point, it is considered a bullish bias; if it remains below, it indicates a bearish bias. Price may reverse near Resistance 1 or Support 1. If it moves further, the next potential reversal zone is near Resistance 2 or Support 2. If these levels are also broken, we can expect the trend.
When a support or resistance level is broken, it often reverses its role; a broken resistance becomes the new support, and a broken support becomes the new resistance.
If the range(R2-S2) is narrow, the market may become volatile or trend strongly. If the range is wide, the market is more likely to remain sideways
please like and share my idea if you find it helpful
📢 Disclaimer
I am not a SEBI-registered financial adviser.
The information, views, and ideas shared here are purely for educational and informational purposes only. They are not intended as investment advice or a recommendation to buy, sell, or hold any financial instruments.
Please consult with your SEBI-registered financial advisor before making any trading or investment decisions.
Trading and investing in the stock market involves risk, and you should do your own research and analysis. You are solely responsible for any decisions made based on this research.
Wave Analysis

RELIANCE : Analysis and Prediction
Timeframe: 1D
Structure: ABC corrective structure within a broader range
Current Price Zone: ~₹1,458
Market Phase: Post-distribution correction from extended retracement highs
🔍 Big Picture Market Structure (Educational View)
Reliance has completed a strong impulsive upmove, followed by profit booking from an extended Fibonacci retracement zone (113%–127%), which is clearly visible near the recent highs.
This behavior is textbook market psychology:
Smart money distributes positions near extended projections
Late buyers enter near highs
Price then corrects to value zones, where demand is reassessed
The chart now reflects a classic ABC correction:
Wave A: Sharp rejection from supply zone
Wave B: Temporary bounce (short covering + dip buying)
Wave C: Ongoing corrective leg testing demand
📐 Why These Levels Matter (Trading Psychology Explained)
🔴 Supply Zone: ₹1,580–1,610 (113%–127%)
This zone triggered strong selling because:
Long-term holders booked profits
Institutions reduced risk at stretched valuations
Breakout buyers were trapped
📌 Extended Fibonacci zones often act as exhaustion points.
🟡 Golden Support Zone: ₹1,398–1,476 (50%–78.6%)
This zone is critical because:
It represents fair value retracement of the prior rally
Dip buyers and positional traders look for re-entry here
Short sellers start covering partially
🧠 Markets frequently pause or bounce here due to a balance between fear (from longs) and greed (from value buyers).
🔵 Lower Extended Support: ₹1,267–1,305 (127%–113%)
If the golden zone fails:
Confidence of dip buyers weakens
Panic selling increases
Price seeks deeper liquidity
📉 This is where only high-conviction buyers step in.
🟢 Bullish Reaction Scenario (Base Case)
If price:
Holds above ₹1,398–1,420
Shows stabilization (small candles / higher lows)
Then:
First recovery toward ₹1,476 (50%)
Further bounce possible toward ₹1,580
Momentum buyers re-enter above broken VWAP zones
📈 This would be a corrective bounce, not a fresh trend yet.
🔴 Bearish Continuation Scenario (Risk Case)
If price:
Fails to sustain above ₹1,398
Closes decisively below this zone
Then:
Downside opens toward ₹1,305 → ₹1,267
Breakdown reflects loss of confidence by dip buyers
Sentiment shifts from “buy the dip” to “sell on bounce”
🎓 Educational Takeaways for Traders
Extended rallies end with distribution, not collapse
Fibonacci levels work because most traders watch them
Corrections test patience, not intelligence
Price reacts where emotions are highest, not where logic feels comfortable
🧠 Trading Psychology Behind This Chart
Zone Trader Behavior
Highs (1,580–1,610) Greed → Distribution
Pullback begins Hope → Dip buying
Golden zone Fear vs Opportunity
Breakdown Panic & Capitulation
📘 Markets move because people react — levels simply highlight where reactions cluster.
🔮 Price Outlook (Educational Projection)
Above ₹1,420: Range-bound recovery likely
Above ₹1,476: Momentum improves, bounce extension possible
Below ₹1,398: Deeper correction toward ₹1,305
Below ₹1,267: Structure turns weak on higher timeframe
🧾 Conclusion
Reliance is currently in a healthy corrective phase after profit booking from stretched levels.
The ₹1,398–1,476 zone is the most important area to watch — it will decide whether this correction ends as accumulation or turns into distribution continuation.
📌 Let price confirm intent; don’t predict emotions.
⚠️ Disclaimer
This analysis is for educational purposes only. I am not a SEBI registered analyst. Markets are uncertain, and I can be wrong. Please consult a financial advisor before trading or investing.

Gold May RejectGold may Reject from 4610-4620. SL will be 4630 Level. Target will be 4475 zone. As shown in the chart.

Angel One: Big Move Coming SoonAngel One is moving inside a big sideways range for a long time, with price making ups and downs between support and resistance. Recently, the stock formed a triangle pattern, where highs are getting lower and lows are getting higher. This shows pressure building before a big move. Price is currently near the lower side of the triangle, which acts as support around 2,300 – 2,200. As long as this support holds, the stock can move up. A break above the upper trendline will confirm strength and can lead to a strong rally toward new highs. Overall, this looks like accumulation before a breakout, not a breakdown.
Stay Tuned!!!
RD :)

GA SHORTSPrice is in a downtrend. From a momentum standpoint this set up seems very reasonable for shorts. Let's wait and see.

GBPUSDSimilar to EU price has come into a 4H supply and is in a down trend. I will say that was a successful mitigation due to it's strong reaction to the downside and flip in structure.
Will be monitoring the sell zone for possible entries, however I prefer how EU looks like.

Part 1 Technical VS. Institutionalinstitutional trading focuses on large-scale transactions, often executed by financial institutions like banks, hedge funds, or pension funds. They typically have access to significant capital and advanced market insights, and their trades can influence market trends.
On the other hand, technical trading relies on analyzing price charts, patterns, and indicators to make decisions. Technical traders look at historical price movements and use tools like moving averages, support and resistance levels, and oscillators to predict future price movements.
In summary, institutional trading is more about the scale, resources, and market impact, while technical trading is more about patterns, price action, and chart-based strategies.

Bullish Flag Brewing in Bandhan BankBandhan Bank is consolidating after a sharp decline, forming what appears to be a potential bullish flag on the chart. The ongoing pullback is overlapping and corrective , suggesting digestion rather than a fresh impulsive sell-off.
As long as price holds above the 141 support zone , the bullish flag structure remains valid. A decisive breakout above the upper channel boundary would confirm continuation and open the door for higher levels.
Until then, this remains a wait-for-confirmation setup , with clearly defined risk and invalidation.
Disclaimer: This analysis is for educational purposes only and does not constitute investment advice. Please do your own research (DYOR) before making any trading decisions.

NIFTY : Trading levels and Plan for 19-Jan-2026📘 NIFTY Trading Plan – 19 Jan 2026
Timeframe: 15-minute
Gap Consideration: 100+ points
Market Context: Range expansion attempt after corrective swings, key balance area in focus
🔼 SCENARIO 1: GAP UP OPENING (100+ points) 🚀
If NIFTY opens above 25,780, it indicates bullish intent with short-covering.
Immediate hurdle lies at 25,915–25,945 (Last Intraday Resistance zone).
Sustained 15-min close above 25,945 can trigger upside extension.
Next upside projection comes near 26,044.
Expect volatility and profit booking near resistance zones.
Fresh longs only on pullback + hold above resistance.
📌 Options Strategy (Gap Up):
• Bull Call Spread (ATM Buy + OTM Sell)
• Avoid aggressive naked CE near resistance
• Trail profits aggressively 📈
➡️ SCENARIO 2: FLAT / RANGE OPENING ⚖️
If NIFTY opens within 25,660–25,738, expect a no-trade / chop zone.
This zone is marked as Opening Support–Resistance.
Market likely to trap both buyers and sellers initially.
Upside trade only above 25,780 with confirmation.
Downside bias activates below 25,560.
Best suited for option sellers if IV permits.
📌 Options Strategy (Flat Market):
• Short Strangle / Iron Fly (experienced traders only)
• Focus on theta decay ⏳
• Avoid directional bias inside range
🔽 SCENARIO 3: GAP DOWN OPENING (100+ points) 📉
If NIFTY opens below 25,560, selling pressure may resume.
First support zone is 25,530–25,567 (Opening / Last Intraday Support).
Minor bounce possible, but trend remains weak below resistance.
Breakdown below 25,530 opens downside towards:
• 25,423
Avoid bottom fishing without confirmation candle.
📌 Options Strategy (Gap Down):
• Bear Put Spread preferred
• Avoid selling PE in trending downside
• Quick scalps only, book fast 📉
🧠 Risk Management Tips for Options Trading 🛡️
Risk only 1–2% of capital per trade.
Expiry proximity = faster decay & sharper moves.
Prefer spreads over naked buying.
One trade = one idea. No revenge trading.
Always wait for 15-min structure confirmation.
📌 Summary & Conclusion ✨
NIFTY is trading near a critical balance zone.
📍 25,660–25,738 remains the decision-making range.
📍 Break above 25,945 may revive bullish momentum.
📍 Below 25,530, downside risk increases sharply.
Trade light, respect levels, and let the market confirm direction.
⚠️ Disclaimer
This content is for educational purposes only.
I am not a SEBI registered analyst.
Markets are uncertain, and I can be wrong.
Please consult your financial advisor before trading.

Bajaj Auto Knocks on ResistancePrice is currently trading near 9,888, pressing into a major resistance / supply zone around 9,900–10,000 . The broader decline from the highs continues to unfold as a complex corrective structure , with the ongoing rise best labeled as Wave X .
The advance into this zone lacks impulsive strength and shows overlapping, corrective characteristics , keeping the larger bearish structure intact . This favors the view that Wave X is approaching completion , not the start of a new uptrend.
If price rejects from this resistance band , the next phase should begin as a Wave Y decline , marking a fresh downside leg of the correction. Risk is clearly defined near the recent highs , making this zone attractive from a short-side perspective .
This is a sell-on-rejection area , not a place to chase strength.
Disclaimer: This analysis is for educational purposes only and does not constitute investment advice. Please do your own research (DYOR) before making any trading decisions.

MCX Silver: Healthy Dip Before Next RallyMCX Silver is in a strong long-term uptrend on the daily chart. The market has already completed wave 1, 2, and a strong wave 3 upward. After this big rise, price is now expected to make a normal correction (wave 4). This pullback can come toward the 236,000 area, which is an important support zone. As long as price stays above this support, the overall trend remains bullish. After wave 4 is completed, Silver is expected to start wave 5, which can push prices to new highs. In short, the trend is up, and any dip is a healthy correction, not weakness.
Stay Tuned :)
@Money_Dictators

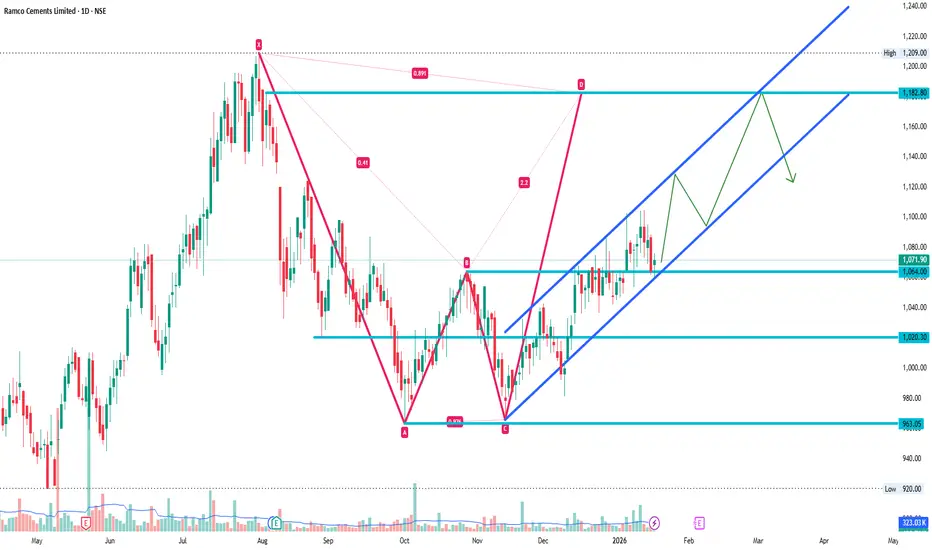
RAMCOCEMRAMCOCEM
bullish trend is Showing on the chart.
buy signals in
technical indicators and
Ascending Channel chart pattern.
BUYING RANGE 1060/1065
Watch for a retest 1060/1065 to sustain the bullish trend. If the resistance holds, there could be a retest towards 940/950 and an uptrend from here.
AUSOMENTAUSOMENT
bullish trend is Showing on the chart.
buy signals in
technical indicators and
BUYING RANGE 125/130
Watch for a breakout above 125/130 to sustain the bullish trend. If the resistance holds, there could be a retest towards 80/85 and an uptrend from here

SOUTHBANKSOUTHBANK
bullish trend is Showing on the chart.
buy signals in
technical indicators and
Inverse Head & Shoulders (Weekly) chart pattern.
BUYING RANGE 34/36
Watch for a breakout above 34/36 to sustain the bullish trend. If the resistance holds, there could be a retest towards 20/22 and an uptrend from here.

Divergence Secrets Risks Involved in Options Trading
While options offer attractive opportunities, they also carry significant risks:
Time Decay (Theta): Option value decreases as expiration approaches.
Volatility Risk: Changes in market volatility can impact option prices.
Unlimited Loss for Sellers: Option writers may face large losses if the market moves sharply.
Complexity: Options pricing depends on multiple factors, making them harder to master than stocks.
Because of these risks, proper risk management and education are crucial.

Part 2 Support and ResistanceOption Pricing and the Greeks
Option prices are influenced by factors such as the underlying price, time to expiration, volatility, interest rates, and dividends. These factors are measured using Greeks, including:
Delta: Sensitivity to price changes in the underlying asset.
Gamma: Rate of change of delta.
Theta: Impact of time decay.
Vega: Sensitivity to volatility.
Rho: Impact of interest rate changes.
Understanding Greeks helps traders manage risk more effectively.

Part 1 Support and Resistance Options Trading vs. Stock Trading
Compared to stock trading, options trading offers:
Lower capital requirement
More strategic flexibility
Ability to profit in rising, falling, or sideways markets
However, it also demands deeper knowledge, discipline, and continuous monitoring.

Dr Reddy’s Labs:Oversold Bounce Likely, But Structure Still WeakPrice has now reached a key demand / support zone , while RSI has slipped into oversold territory , a setup that often precedes a technical bounce . From a pure momentum perspective, a short-term relief rally looks likely .
However, the broader structure remains corrective . The stock continues to trade below two declining trendline resistances , and the 50-DMA is hovering near a bearish crossover with the 200-DMA , keeping the higher-timeframe bias under pressure.
The recent price action shows overlapping, choppy swings , best interpreted as multiple minor and higher-degree double corrections . Any bounce from current levels is therefore expected to be counter-trend and corrective in nature , not the start of a new uptrend.
Unless price can reclaim the falling resistance and sustain above key moving averages , the risk of a larger Wave Y decline toward the ~1,020 zone remains open. Rallies, if any, are likely to face supply and should be treated with caution.
In summary:
Oversold bounce likely from support
Bounce expected to be corrective
Trend still weak below resistances
Wave Y risk remains toward ~1,020
Disclaimer: This analysis is for educational purposes only and does not constitute investment advice. Please do your own research (DYOR) before making any trading decisions.

Part 12 Trading Master Class With Experts Types of Options
Options are mainly divided into two categories:
Call Options
A call option gives the buyer the right to buy the underlying asset at a specified price (strike price) before or on the expiration date.
Example: Suppose a stock trades at ₹1,000, and you buy a call option with a strike price of ₹1,050, expiring in one month. If the stock rises to ₹1,100, you can buy it at ₹1,050 and profit from the difference, minus the premium paid.
Put Options
A put option gives the buyer the right to sell the underlying asset at a specified price before or on the expiration date.
Example: Suppose a stock trades at ₹1,000, and you buy a put option with a strike price of ₹950. If the stock drops to ₹900, you can sell it at ₹950 and profit, minus the premium paid.

Btc Blood BathI think these are the crucial level as supply is increasing day by day and demand are not making highs so there should be opportunity to get lower levels as per my analysis plz don't trade on my analysis 🙏

L&T: Wave 5 Exhaustion Signals a Corrective PhaseA clear 5-wave impulse has played out, with Wave 3 showing classic overbought RSI behavior while still respecting Elliott Wave rules.
Wave 5 ended with RSI divergence , signaling exhaustion near the highs.
Price has now slipped below the 100-DMA , reinforcing the view that the advance has likely stalled and a corrective phase is underway. The decline should unfold in at least a 3-wave structure . Importantly, Wave (a) may not be complete yet . Despite RSI reaching oversold levels, there is no decisive reversal signal so far. Any near-term bounce could turn out to be a dead-cat bounce , potentially forming Wave (b) rather than a trend reversal.
The previous accumulation zone , which also aligns with the 50% Fibonacci retracement , remains a key area to monitor. Until the corrective structure is fully resolved, bounces are best treated as counter-trend moves , not fresh longs.
Disclaimer: This analysis is for educational purposes only and does not constitute investment advice. Please do your own research (DYOR) before making any trading decisions

Mistakes Traders Must Avoid to Succeed in Financial Markets1. Trading Without a Plan
One of the most common and dangerous mistakes traders make is entering the market without a clear trading plan. A trading plan defines entry points, exit targets, stop-loss levels, position size, and risk tolerance. Without a plan, decisions are driven by emotions rather than logic. Traders who operate impulsively often overtrade, exit too early, or hold losing positions for too long. A well-defined plan provides structure, reduces confusion, and helps traders stay disciplined even during volatile market conditions.
2. Ignoring Risk Management
Risk management is the backbone of successful trading, yet many traders overlook it. Risking too much capital on a single trade can wipe out weeks or even months of gains. Professional traders usually risk only a small percentage of their capital—often 1–2%—per trade. Ignoring stop-loss orders, increasing position size after losses, or using excessive leverage exposes traders to catastrophic losses. Protecting capital should always be the first priority.
3. Letting Emotions Control Decisions
Emotional trading is a silent account killer. Fear, greed, hope, and frustration influence traders to make irrational decisions. Fear may cause early exits from profitable trades, while greed can lead to holding positions longer than planned. Revenge trading—placing impulsive trades after a loss to recover money quickly—is another emotional trap. Successful traders learn to detach emotionally from trades and follow their strategy consistently, regardless of short-term outcomes.
4. Overtrading
Overtrading occurs when traders place too many trades, often without valid setups. This usually happens due to boredom, overconfidence, or the desire to recover losses quickly. Excessive trading increases transaction costs, reduces focus, and leads to poor-quality decisions. Markets do not offer opportunities all the time, and waiting patiently for high-probability setups is a key skill every trader must develop.
5. Lack of Proper Market Knowledge
Many traders enter the market without fully understanding how it works. Trading without knowledge of market structure, technical analysis, fundamental factors, or economic events increases the chances of failure. For example, ignoring earnings announcements, economic data releases, or central bank decisions can lead to unexpected volatility. Continuous learning and staying updated with market dynamics are essential for long-term success.
6. Not Using Stop-Loss Orders
Refusing to use stop-loss orders is a costly mistake. Some traders avoid stop-losses hoping the market will reverse in their favor. Unfortunately, losses can grow rapidly, damaging both capital and confidence. Stop-loss orders act as a safety net, limiting losses and allowing traders to live to trade another day. Accepting small losses is a part of trading and is far better than suffering large, uncontrollable drawdowns.
7. Chasing the Market
Chasing trades after a big price move often results in entering at the worst possible time. Traders see a stock or asset moving sharply and fear missing out (FOMO). As a result, they enter late, just before a reversal or correction. Successful traders wait for proper pullbacks, confirmations, and setups rather than reacting emotionally to sudden price movements.
8. Poor Position Sizing
Even a good strategy can fail if position sizing is incorrect. Taking positions that are too large increases emotional stress and amplifies losses. Conversely, positions that are too small may not justify the effort or risk taken. Proper position sizing ensures that each trade aligns with the trader’s risk tolerance and overall capital management strategy.
9. Lack of Patience and Discipline
Markets reward patience, but many traders want quick profits. Impatience leads to entering trades prematurely, ignoring confirmation signals, or exiting winning trades too early. Discipline is required to follow the trading plan consistently, even after a series of losses or wins. Traders who lack discipline often change strategies frequently, never giving one approach enough time to prove its effectiveness.
10. Failing to Keep a Trading Journal
A trading journal is a powerful learning tool, yet many traders neglect it. Without reviewing past trades, it is difficult to identify mistakes, strengths, and patterns in behavior. A journal helps traders understand what works, what doesn’t, and why. Over time, this self-analysis leads to improved strategies and better decision-making.
11. Unrealistic Expectations
Many traders enter the market expecting quick and easy money. This mindset leads to excessive risk-taking and disappointment. Trading is a skill that requires time, practice, and patience. Unrealistic expectations often cause traders to abandon good strategies prematurely or take unnecessary risks in pursuit of fast profits.
12. Not Adapting to Market Conditions
Markets change over time—trends, volatility, and liquidity are not constant. Traders who fail to adapt their strategies to changing conditions often struggle. A strategy that works in a trending market may fail in a sideways market. Successful traders regularly review and adjust their approach based on current market behavior.
Conclusion
Avoiding common trading mistakes is just as important as finding profitable opportunities. Trading success is not about perfection, but about consistency, discipline, and continuous improvement. By developing a solid trading plan, practicing effective risk management, controlling emotions, and committing to lifelong learning, traders can significantly improve their performance. Markets will always be uncertain, but traders who avoid these critical mistakes place themselves in a far stronger position to achieve long-term success.

NAS100 buy setupThere is a good opportunity to go long in Nas100, if it gets LTF confirmation then it will be great, always keep your risk under control.
