Real Knowledge Chart Patterns Why Candlestick Patterns Matter
Candlestick patterns matter because they reflect real-time trader behavior:
Are bulls becoming aggressive?
Are bears weakening?
Is a reversal coming?
Is the trend gaining strength?
Are institutions absorbing liquidity?
In Volume Profile or Market Structure context:
A candle pattern near value areas confirms reversals.
A candle pattern at breakout zones confirms continuation.
A candle pattern after liquidity grabs confirms orderflow shift.
Wave Analysis

Indian Derivatives on Power & Energy MarketsFocus on VPPA and OTC Structures
India’s power and energy markets are undergoing a structural transformation driven by renewable energy expansion, power market reforms, decarbonization goals, and increasing participation from corporates and financial players. Alongside physical electricity trading, derivative instruments—especially Virtual Power Purchase Agreements (VPPAs) and OTC energy derivatives—are emerging as essential tools for price risk management, revenue stability, and sustainability compliance.
Unlike mature power derivative markets such as Europe or the US, India’s energy derivatives ecosystem is still nascent but evolving rapidly, shaped by regulatory caution, exchange-based reforms, and corporate demand for green power.
1. Evolution of Power Markets in India
Historically, India’s electricity sector operated under long-term physical PPAs between generators and state distribution companies (DISCOMs). Prices were regulated, and price risk was minimal.
Key changes over the last decade:
Rapid growth in renewable energy (solar, wind)
Introduction of power exchanges (IEX, PXIL)
Move towards market-based economic dispatch (MBED)
Entry of corporates as power buyers
Volatility in spot and real-time electricity prices
This shift has created a strong need for hedging instruments similar to commodities, interest rates, or FX derivatives.
2. What Are Power & Energy Derivatives?
Power and energy derivatives are financial contracts whose value is linked to:
Electricity prices (spot, day-ahead, real-time)
Renewable energy output
Fuel prices (coal, gas)
Emission or renewable attributes
They help participants:
Hedge price volatility
Lock in long-term power costs
Stabilize revenues for renewable generators
Meet ESG and decarbonization targets
In India, derivatives are primarily OTC-based, with limited exchange-traded participation.
3. Virtual Power Purchase Agreements (VPPA)
What is a VPPA?
A VPPA is a financial (non-physical) contract where:
A corporate buyer agrees to a fixed price for renewable power
The generator sells electricity into the market at floating prices
The difference between the fixed VPPA price and market price is financially settled
No physical delivery of electricity occurs
In essence, a VPPA is a Contract for Difference (CfD) applied to power.
VPPA Structure in the Indian Context
Parties involved:
Renewable energy generator (solar/wind)
Corporate buyer (IT firms, data centers, manufacturing, MNCs)
Power exchange or market price reference
Settlement and billing agent
Cash flow example:
VPPA strike price: ₹4.00/unit
Market price: ₹3.50/unit
→ Corporate pays generator ₹0.50/unit
Market price: ₹4.50/unit
→ Generator pays corporate ₹0.50/unit
The physical electricity continues to be sold independently in the market.
Why VPPAs Matter in India
Corporate Renewable Demand
Large Indian and global corporates operating in India want renewable sourcing without dealing with:
Open access complexity
State-level cross-subsidy charges
Transmission constraints
Price Hedging
Corporates hedge long-term power costs while generators hedge revenue volatility.
ESG and RE100 Commitments
VPPAs allow companies to claim renewable procurement benefits without physical delivery.
Financing Renewable Projects
Stable VPPA cash flows improve bankability for renewable projects.
Regulatory Status of VPPAs in India
VPPAs are not explicitly regulated by CERC/SEBI yet
Typically structured as private OTC financial contracts
Settlement references:
Day-Ahead Market (DAM)
Real-Time Market (RTM)
Legal clarity is evolving; contracts are carefully drafted to avoid being classified as speculative derivatives
India is moving cautiously compared to global markets.
4. OTC (Over-the-Counter) Energy Derivatives in India
What Are OTC Energy Derivatives?
OTC derivatives are bilateral contracts negotiated privately between parties, not traded on exchanges.
Common OTC instruments in Indian energy markets:
Fixed-for-floating power swaps
Renewable generation hedges
Fuel cost pass-through hedges
Long-term price floors and caps
Key OTC Power Derivative Structures
1. Fixed-Price Power Swap
Buyer pays fixed power price
Seller pays floating market price
Used by DISCOMs and large consumers
2. Price Cap and Floor Contracts
Protects buyers from price spikes
Protects generators from price crashes
3. Load Following Contracts
Settlement based on actual consumption profile
Useful for data centers and industrial users
4. Renewable Output-Linked Swaps
Settlement linked to actual solar/wind generation
Manages intermittency risk
Participants in OTC Energy Derivatives
Renewable power producers
Thermal power generators
Large industrial consumers
Corporates with ESG mandates
Energy trading companies
Financial intermediaries (limited)
Banks currently play a minimal role due to regulatory ambiguity.
5. Exchange-Traded vs OTC Derivatives in India
Aspect Exchange-Traded OTC
Transparency High Low
Customization Limited High
Counterparty Risk Low Higher
Regulation Strong Evolving
Liquidity Low (India) Moderate
Indian power exchanges currently focus on spot, term-ahead, and real-time markets, while derivatives remain mostly OTC.
6. Key Challenges in Indian Power Derivatives
Regulatory Uncertainty
Unclear demarcation between power contracts and financial derivatives.
SEBI vs CERC Jurisdiction
Power contracts fall under CERC, financial derivatives under SEBI—overlap creates hesitation.
DISCOM Financial Stress
Weak creditworthiness limits participation.
Low Market Depth
Limited liquidity restricts price discovery.
Accounting & Tax Treatment
Unclear GST and accounting classification for VPPA settlements.
7. Future Outlook of Power Derivatives in India
The long-term outlook is structurally bullish:
Market-Based Economic Dispatch will increase price volatility
Renewable penetration >50% by 2030 increases intermittency
Corporate green demand continues to rise
Power futures and options are expected on exchanges
Green attributes and carbon-linked derivatives may emerge
India is likely to follow a hybrid model:
OTC dominance initially
Gradual migration to regulated exchange-based derivatives
8. Strategic Importance for Investors and Traders
For traders and institutional investors:
Power derivatives offer non-correlated returns
Seasonal and weather-driven volatility creates opportunities
Renewable intermittency increases optionality value
For corporates:
VPPAs act as both hedging tools and ESG instruments
For generators:
Stable revenues improve project valuation and refinancing ability
Conclusion
Indian derivatives in power and energy markets—especially VPPAs and OTC contracts—represent the next phase of financial sophistication in the country’s energy transition. While regulatory clarity is still evolving, the economic need for price risk management, renewable integration, and corporate sustainability ensures sustained growth.
As India moves toward a more market-driven power system, energy derivatives will shift from optional tools to essential financial infrastructure, shaping how electricity is priced, traded, and financed in the coming decade.

Algorithmic Strategies for Cross-Asset Futures1. Concept of Cross-Asset Futures Trading
Cross-asset futures trading involves taking positions in two or more futures contracts from different asset classes based on statistical, macroeconomic, or structural relationships. Instead of predicting absolute price direction, these strategies often focus on relative value, correlation, or transmission of information across markets.
For example:
Bond yields rising may negatively impact equity index futures.
Crude oil futures may influence inflation expectations and currency futures.
Gold futures may react to movements in real yields and USD futures.
Algorithms systematically quantify and trade these relationships at scale.
2. Asset Classes Commonly Used
Cross-asset futures strategies typically span:
Equity Index Futures (S&P 500, Nifty 50, Nasdaq, DAX)
Interest Rate Futures (Treasury futures, Gilt futures)
Commodity Futures (Crude oil, gold, copper, agricultural products)
Currency Futures (USD, EUR, JPY, INR)
Volatility Futures (VIX)
The diversity of instruments improves portfolio robustness and diversification.
3. Core Types of Cross-Asset Algorithmic Strategies
A. Inter-Market Spread Trading
Inter-market spread strategies exploit pricing relationships between futures in different asset classes.
Examples:
Long equity index futures and short bond futures during reflationary phases.
Long copper futures and short gold futures to express a “risk-on” view.
Algorithms monitor historical spreads, z-scores, and cointegration metrics to identify deviations from equilibrium and execute trades when spreads are statistically stretched.
Key tools:
Cointegration analysis
Z-score normalization
Kalman filters for dynamic spreads
B. Macro-Driven Regime Strategies
These algorithms classify the macro environment into regimes such as:
Growth acceleration
Inflation shock
Deflation risk
Risk-off crisis
Each regime has predefined cross-asset positioning rules.
Example:
Inflationary regime: Long commodities, short bonds, selective equity exposure.
Risk-off regime: Long bond futures, long gold futures, short equity futures.
Machine learning classifiers or rule-based macro indicators (PMI, CPI, yield curve slope) are often used for regime detection.
C. Correlation and Breakdown Strategies
Cross-asset correlations are not static. Algorithms monitor rolling correlations between assets and trade correlation breakdowns.
Example:
If equities and bonds suddenly turn positively correlated during stress, the model adjusts hedges or exploits the shift.
These strategies are especially effective during crisis periods when traditional correlations fail.
Common methods:
Rolling correlation matrices
Principal Component Analysis (PCA)
Dynamic Conditional Correlation (DCC-GARCH)
D. Lead-Lag Strategies
Some markets react faster to new information than others. Algorithms identify leading assets and trade lagging ones.
Examples:
Currency futures reacting before equity futures to rate expectations.
Energy futures leading inflation-sensitive bond futures.
High-frequency or medium-frequency data is used to detect causality using:
Granger causality tests
Transfer entropy
Time-shifted regressions
E. Risk Parity and Volatility Targeting
Cross-asset futures portfolios often use risk parity, where capital allocation is based on volatility rather than notional value.
Key characteristics:
Lower allocation to volatile assets like equities
Higher allocation to stable assets like bonds
Continuous rebalancing based on realized volatility
Algorithms dynamically adjust exposure so that each asset class contributes equally to portfolio risk.
F. Statistical Arbitrage Across Asset Classes
These strategies treat futures contracts as components of a statistical system rather than economic instruments.
Examples:
Mean-reversion between commodity indices and equity indices
Cross-sectional ranking of futures returns across asset classes
Models may include:
Multivariate regression
Factor models
Machine learning clustering techniques
4. Data and Infrastructure Requirements
Cross-asset futures strategies are data-intensive.
Required data:
Futures price data (continuous contracts)
Macro data (rates, inflation, growth indicators)
Volatility indices
Correlation and covariance matrices
Infrastructure:
Low-latency execution for intraday strategies
Robust backtesting engines
Risk management and margin optimization systems
Institutional-grade systems are preferred due to the complexity of managing multiple asset classes.
5. Risk Management in Cross-Asset Algorithms
Risk management is central to cross-asset futures trading.
Key risks:
Correlation breakdown risk
Leverage and margin risk
Liquidity risk during stress events
Model overfitting
Risk controls:
Portfolio-level drawdown limits
Volatility scaling
Stop-loss at spread and portfolio level
Stress testing across historical crises
Many strategies cap risk at the portfolio level rather than individual trades, reflecting the interconnected nature of assets.
6. Advantages of Cross-Asset Futures Strategies
Diversification across asset classes
Ability to profit in both trending and sideways markets
Reduced reliance on single-market direction
Strong performance during macro regime shifts
Capital efficiency due to futures leverage
These advantages make cross-asset strategies attractive for institutional portfolios.
7. Limitations and Challenges
Despite their strengths, these strategies face challenges:
Changing macro relationships
Data quality issues across asset classes
High complexity and maintenance cost
Regulatory and margin changes affecting futures trading
Models must be continuously monitored and adapted.
8. Future Trends
The future of cross-asset futures algorithms includes:
AI-driven regime detection
Alternative data integration (shipping, satellite, flows)
Real-time macro nowcasting
Improved tail-risk hedging models
As global markets become more interconnected, cross-asset algorithms will become even more relevant.
Conclusion
Algorithmic strategies for cross-asset futures represent one of the most sophisticated forms of systematic trading. By exploiting relationships across equities, bonds, commodities, currencies, and volatility, these strategies move beyond single-market forecasting toward a holistic view of global financial systems. When combined with robust risk management, disciplined execution, and adaptive models, cross-asset futures algorithms can deliver consistent, diversified performance across market cycles.

Renewable Energy Certificates & Carbon Credits1. What Are Renewable Energy Certificates (RECs)?
Definition
A Renewable Energy Certificate (REC) represents the environmental attributes of electricity generated from renewable sources such as solar, wind, hydro, biomass, or geothermal. One REC is issued for every 1 megawatt-hour (MWh) of renewable electricity generated and supplied to the grid.
When renewable power is produced, two components are created:
Physical electricity (indistinguishable once on the grid)
Environmental benefit (tracked separately through RECs)
The REC allows the renewable benefit to be claimed, traded, or retired, even if the actual electricity is consumed elsewhere.
2. Purpose of RECs
RECs exist primarily to:
Promote renewable energy adoption
Enable compliance with renewable energy mandates
Allow organizations to claim renewable energy usage
Support corporate sustainability and ESG goals
Because electricity on the grid is a mix of sources, RECs solve the attribution problem—allowing buyers to say, “We used renewable electricity,” even if electrons came from mixed sources.
3. Types of REC Markets
a) Compliance RECs
These are used to meet government-mandated renewable obligations, such as:
Renewable Purchase Obligations (RPOs) in India
Renewable Portfolio Standards (RPS) in the US
Utilities and obligated entities must procure a certain percentage of power from renewable sources or purchase RECs to comply.
b) Voluntary RECs
Corporates, institutions, and individuals purchase these to:
Reduce their carbon footprint
Meet net-zero or carbon neutrality commitments
Enhance brand sustainability credentials
4. How REC Markets Work
Renewable generator produces electricity
REC is issued by a registry
REC is sold to buyers
Buyer retires the REC to claim renewable usage
Once retired, a REC cannot be resold, ensuring no double counting.
5. Benefits and Limitations of RECs
Benefits
Encourages renewable project viability
Provides additional revenue to clean energy producers
Enables corporate climate action
Transparent and standardized tracking
Limitations
RECs do not directly reduce emissions; they support cleaner generation
Risk of greenwashing if used without broader decarbonization
Impact depends on market integrity and additionality
6. What Are Carbon Credits?
Definition
A carbon credit represents the reduction, removal, or avoidance of 1 metric tonne of carbon dioxide (CO₂) or equivalent greenhouse gases (CO₂e).
Carbon credits are generated by projects that:
Reduce emissions (e.g., energy efficiency)
Avoid emissions (e.g., clean cooking stoves)
Remove carbon (e.g., afforestation, carbon capture)
7. Purpose of Carbon Credits
Carbon credits exist to:
Put a price on carbon emissions
Encourage emission reductions where they are cheapest
Help entities offset unavoidable emissions
Support climate finance in developing regions
They are especially useful for hard-to-abate sectors like aviation, cement, steel, and shipping.
8. Types of Carbon Markets
a) Compliance Carbon Markets
Governed by regulations such as:
Emissions Trading Systems (ETS)
Cap-and-Trade programs
Governments cap total emissions and allocate or auction allowances. Companies exceeding limits must buy credits.
b) Voluntary Carbon Markets (VCM)
Corporations and individuals voluntarily purchase credits to:
Offset emissions
Achieve carbon neutrality
Support sustainability initiatives
Credits are certified by standards like Verra, Gold Standard, or national registries.
9. How Carbon Credits Are Created
Project is designed (e.g., wind farm, forest conservation)
Emission reductions are calculated using approved methodologies
Independent verification is conducted
Credits are issued
Credits are sold and eventually retired
Key principles include additionality, permanence, measurability, and no double counting.
10. Benefits and Challenges of Carbon Credits
Benefits
Cost-effective emission reductions
Mobilizes private climate finance
Encourages innovation and clean technologies
Supports sustainable development goals (SDGs)
Challenges
Concerns about quality and credibility
Risk of overstated reductions
Permanence risks (e.g., forest fires)
Complexity in measurement and verification
11. Key Differences Between RECs and Carbon Credits
Aspect RECs Carbon Credits
Unit 1 MWh renewable electricity 1 tonne CO₂e
Purpose Promote renewable energy Offset or reduce emissions
Market Electricity & sustainability Climate & emissions
Emission Impact Indirect Direct
Usage Claim “We used renewable energy” “We offset emissions”
12. Role in Corporate ESG and Net-Zero Strategies
Modern climate strategies typically follow a hierarchy:
Avoid emissions
Reduce emissions
Replace fossil energy with renewables (RECs)
Offset residual emissions (Carbon Credits)
RECs help decarbonize Scope 2 emissions (electricity), while carbon credits often address Scope 1 and Scope 3 residuals.
13. Future Outlook
The role of RECs and carbon credits is expanding due to:
Global net-zero commitments
Increasing carbon disclosure regulations
Growth in ESG investing
Rising corporate accountability
However, future markets will demand:
Higher transparency
Stronger standards
Better alignment with real-world emission reductions
Governments are also exploring Article 6 mechanisms under the Paris Agreement, which could reshape international carbon trading.
14. Conclusion
Renewable Energy Certificates and Carbon Credits are powerful yet distinct climate instruments. RECs accelerate the transition to clean electricity by monetizing renewable attributes, while carbon credits enable emissions reductions beyond organizational boundaries. When used responsibly—not as substitutes for direct decarbonization but as complementary tools—they play a crucial role in achieving global climate goals.

NIFTY 5M – Fresh Long Entry After Retracement | Fibonacci-Based NIFTY has respected the 0.382–0.5 Fibonacci retracement zone and is showing a clean bullish response on the 5-minute timeframe.
🔹 Fresh Long Entry: 25250
🔹 Invalidation / SL: Below 25100
🔹 Upside Target: 25555
🔹 Structure: Higher Low + Strong Impulse
🔹 Context: Trend continuation after healthy pullback
This setup aligns with price structure + Fibonacci confluence, suitable for intraday momentum traders.
⚠️ Trade with proper risk management.
📊 Not financial advice.

A Completed Impulse Now Gives Way to Correction in VoltasFrom its inception low near ₹2.60 , Voltas has unfolded a clear long-term 5-wave impulsive advance on the monthly timeframe , culminating near ₹1,994.90 . The structure of this move aligns well with classical Elliott Wave principles, suggesting that a larger-degree impulse cycle has likely concluded .
Following this structural completion, price action has transitioned into a corrective phase . The initial decline fits well as Wave W , unfolding in a zigzag structure . This has been followed by a rebound that appears corrective in nature and can be interpreted as the connector Wave X .
If this interpretation holds, the broader correction may continue with one more leg lower in Wave Y , potentially drawing price toward the 50% Fibonacci retracement zone of the entire impulse. Such behavior would be consistent with a higher-degree corrective process , rather than a trend reversal.
Until the corrective structure is fully resolved, any interim rallies are more likely to be corrective in nature and may be viewed as potential selling opportunities , rather than the start of a new impulsive advance.
At this stage, the focus remains on structure and price behavior , as corrective phases tend to be overlapping and time-consuming . The larger trend remains intact, but patience is required before expecting trend resumption.
Disclaimer: This analysis is for educational purposes only and does not constitute investment advice. Please do your own research (DYOR) before making any trading decisions.

Bajaj Finance: Impulse Complete, Correction in ControlBajaj Finance completed a clean five-wave impulsive advance , topping out near ₹1,102.5 , followed by a clear loss of momentum. Since that peak, price action has shifted from trend to overlap , signaling a corrective phase rather than continuation.
Structurally, the decline is unfolding within a descending channel , fitting well with a W–X–Y corrective structure . The internal swings remain choppy and overlapping — classic correction behavior — with price respecting the channel boundaries so far.
During the impulsive rally ( Waves 1–5 ), the 50 DMA acted as dynamic support , confirming strong upside momentum. Post the top, price has slipped below the 50 DMA and is now oscillating around it, indicating momentum fatigue . A sustained hold below the 50 DMA, combined with a rollover in the average , would reinforce the short-term bearish / corrective bias , with the average potentially flipping into dynamic resistance .
From a price projection perspective, the ongoing Wave Y is favoring a move toward key Fibonacci retracement levels . The 0.618 retracement near ₹945 stands out as a high-probability reaction zone , while a deeper flush could extend toward the 0.786 retracement near ₹903 if downside pressure accelerates.
Risk is clearly defined. A sustained break above the upper boundary of the corrective channel would invalidate the W–X–Y interpretation and signal a structural shift back toward strength . Until then, the path of least resistance remains corrective .
Bottom line:
The impulsive phase is done. The market is digesting gains. Structure — not emotion — favors patience and respect for the corrective channel.
Disclaimer:
This analysis is for educational purposes only and does not constitute investment advice. Please do your own research (DYOR) before making any trading decisions.

[SeoVereign] BITCOIN BULLISH Outlook – January 21, 2025The market’s direction is becoming increasingly ambiguous.
As the market fails to present a clear directional bias,
I am likewise experiencing considerable difficulty in reading its flow.
The current market environment is characterized by a significant expansion in volatility, where movements suggesting the completion of a downtrend and a transition to an upward phase are repeatedly followed by sharp retracements that erase the entirety of the advance.
From a short-term perspective, this represents an extremely fatiguing phase; however, from a macro perspective, it corresponds to a textbook consolidation range.
Consolidation is generally perceived as a tedious and painful phase, yet it is crucial to recognize that the longer a consolidation persists, the more powerful the volatility that tends to follow thereafter.
Many market participants become fixated on the minor fluctuations that occur within consolidation ranges, repeatedly engaging in forced and excessive trades, thereby eroding their capital. As a result, when a decisive trend finally emerges, they are placed in the critical situation of being unable to participate in that move.
Accordingly, the most important priority at this stage is not to hastily predict the next move, but to preserve capital through rigorous risk management.
From the perspective of directional analysis, time itself represents the accumulation of evidence.
By way of analogy, when eating with one’s eyes covered, it is difficult to identify the food immediately after placing it in one’s mouth; only through repeated chewing and swallowing does the taste and composition become clear.
The current market is likewise passing through a very prolonged consolidation phase, and the evidence accumulated during this process will ultimately indicate the future direction and magnitude with greater clarity.
In general, when consolidation persists to this extent, the subsequent move tends to be relatively clear.
That said, at the present moment, I am assigning equal probability to both upside and downside scenarios. While it is unusual for directionality to remain unclear after such an extended consolidation, experience suggests that in these conditions, there is often a marginally higher probability of an additional downward extension of the existing trend.
However, within my analytical framework, signals have also been detected that provide sufficient grounds to assert the possibility of an immediate upward move.
In circumstances where indicators conflict in this manner, the optimal approach is to exercise patience and wait for a point at which directionality becomes clearly defined.
Accordingly, I am currently maintaining a strategy centered on short-term trading within the 15-minute timeframe, and I would like to share a newly identified bullish perspective observed within the same timeframe.
At present, the price structure is approaching the completion zone of a 1.902 Deep Crab pattern formed following a downtrend.
While completion of such a pattern does not allow one to definitively conclude a trend reversal, it is nonetheless classified as a region where technical reactions and attempts at short-term structural shifts are highly likely to occur within a broader downtrend.
In other words, it represents an area where selling pressure tends to weaken near the tail end of a decline and where short-term buying responses may emerge.
Such structures typically form in zones where fear among market participants reaches its peak.
Additionally, the Fibonacci retracement zone of 0.5 to 0.618, measured from the recent high-to-low downward impulse, precisely overlaps with the pattern completion area.
Based on these technical factors, the average target zone has been set at 92,500 USDT, and I plan to respond flexibly through the expansion and reduction of long positions.
I will continue to closely monitor market reactions and provide ongoing updates should there be any changes in perspective or additional analytical developments.
This concludes the current idea.

BTC/USD looking for major correction? AB - Completed on daily TF, C started... With confirmation of breaking upward trendline. ..
C target are big, may test 54K.. in coming week/ months.

Platinum Forecast - 3000-3500+ possible in near futureCurrently it is consolidating at the ATH breakout line, once it picks up the momentum it will head towards 3000-3500+ levels..

VEDL 1 Week Time Frame 📊 Current Price Context (approximate latest)
• Vedanta is trading around ₹660‑₹675 range on NSE as of the latest session.
📈 Weekly Resistance Levels
These are levels where the stock might face selling pressure on an upward move:
Resistance Zones
1. ₹682–₹688 area – near recent intraday highs and 52‑week high cluster.
2. ~₹693–₹700 – broader higher resistance in week ahead.
3. Above ₹700 – extended breakout zone if bullish momentum accelerates.
👉 Bullish breakout triggers shorter‑term targets toward these zones, especially if sustained above daily pivots/resistance.
📉 Weekly Support Levels
These are areas where price might find buyers or pullback cushions:
Support Zones
1. ~₹665–₹658 – immediate weekly support cluster.
2. ~₹647–₹648 – next meaningful support if the price weakens.
3. ~₹620–₹630 – deeper pivot/demand zone from recent action (from broader short‑term analysis).
4. ~₹560–₹570 – more distant support if the stock corrects further from current levels.
👉 A break below ₹658–665 on weekly closes could shift bias toward deeper support ranges.
🔁 1‑Week Bias Summary
Scenario Level to Watch What It Implies
Bullish continuation Above ₹682–₹688 Can target ₹693–₹700+
Neutral / congestion ₹665–₹658 Choppy range, sideways trades
Bearish correction Below ₹658 Deeper support at ₹620–₹570+

Part 1 Ride The Big Moves What Are Options?
Options are financial derivatives—meaning their value is derived from an underlying asset such as stock, index, commodity, etc. They are contracts between two parties: the option buyer and the option seller (writer).
There are two types of options:
Call Option (CE) – Right to buy the asset at a fixed price.
Put Option (PE) – Right to sell the asset at a fixed price.
The key point:
The buyer has a right but no obligation. The seller has an obligation but no rights.

Elliott Wave Analysis XAUUSD – January 21, 2026
Momentum
– Daily (D1) momentum is currently increasing, indicating that the bullish trend is still intact and the upward move has not yet finished.
– H4 momentum is compressing in the overbought zone. This shows that the uptrend is still being maintained; however, momentum has weakened and a potential reversal may occur at any time.
– H1 momentum has started to reverse, suggesting that a short-term corrective pullback on the H1 timeframe is likely.
Wave Structure
Daily (D1) Timeframe
– On the daily chart, price remains within the blue Wave 5 structure, with Wave 5 continuing to extend.
– The next key level to monitor is 4957, which corresponds to the 1.0 Fibonacci extension of the Wave 1–3 range.
H4 Timeframe
– The current rally is steep and impulsive, suggesting that price is likely moving within orange Wave 3.
– Inside orange Wave 3, we can clearly observe a five-wave structure (1–2–3–4–5) marked in green, as shown on the chart.
– According to Elliott Wave principles, once Wave 3 is completed, the market should enter a corrective phase forming orange Wave 4.
– It is important to note that H4 momentum is compressed in the overbought zone, signaling that while the bullish move may continue, momentum is weakening and reversal risk is increasing.
– However, since the blue Wave 5 is still extending, by principle we should not attempt to fade or counter-trade an extending wave.
H1 Timeframe
– Within the green five-wave structure, we can also identify a purple 1–2–3–4–5 structure, with purple Wave 3 currently extending.
– By principle, it is not advisable to project precise targets for an extending wave, as accuracy is typically very low.
– At this stage, the best approach is to remain patient and continue observing for additional confirmation, rather than taking aggressive sell positions while the bullish structure remains dominant.

LTIM — Corrective Rally Exhaustion, 3-Wave Decline in FocusThe advance in LTI Mindtree Ltd (LTIM) from 3,802 is interpreted as a corrective ABC structure , rather than the start of a fresh impulsive trend.
Wave A advanced to 5,554.50
Wave B corrected lower within a falling channel , ending near 4,939.50
Wave C unfolded in five waves and terminated at 6,429.50, accompanied by bearish RSI divergence , signaling momentum exhaustion
Price has now closed below the 50-DMA , indicating weakening bullish momentum. However, Wave (a) is still evolving , and its completion needs to be confirmed through price action.
A probable corrective path ahead:
Completion of Wave (a) on the downside
A Wave (b) bounce potentially initiating from the 100-DMA , if price stabilizes near that zone
Followed by a Wave (c) continuation lower , with downside risk toward the 5,555 zone
As always, price action will dictate the structure , and the wave count will be updated as the move evolves .
Disclaimer: This analysis is for educational purposes only and does not constitute investment advice. Please do your own research (DYOR) before making any trading decisions.

US100 (Nasdaq) – Structure & BiasPrice is currently trading inside a well-defined consolidation range, capped by a major resistance zone near 25,850–25,900 and supported around 25,230–25,250, which has acted as a strong demand flip multiple times.
The recent price action shows:
A liquidity sweep to the downside, followed by a sharp bullish reaction, indicating smart money absorption.
Price reclaiming the mid-range level, suggesting buyers are regaining short-term control.
Compression near support, often a precursor to expansion.
The projected path indicates a minor pullback or sideways consolidation, followed by a bullish continuation toward the upper resistance band. Structure favors upside as long as price holds above the marked support zone.
Key Levels
Support: 25,230 – 25,250
Mid-range equilibrium: ~25,300
Target / Resistance: 25,850 – 25,900
Bias
🟢 Bullish continuation, provided price maintains above the demand zone.
A clean breakout above consolidation could trigger momentum-driven expansion toward the highs.

Tata Consumer Products Ltd – Rising Wedge: Trap or Topping?Price is grinding higher inside a rising wedge , marked by converging trendlines and overlapping structure. This is not impulsive behavior — it fits better as a corrective Wave X , typically seen before the next leg of decline.
Rising wedges often signal distribution, not accumulation. As long as price stays inside the wedge, upside is suspect and slow, not a trend resumption.
The only actionable trigger here is a decisive break below the lower trendline . Until that happens, this remains a waiting game — no hero trades, no early shorts.
If the wedge fails, odds favor a Wave Y decline unfolding next. If price reclaims strength and invalidates the wedge, step aside and reassess.
Patience > prediction. Structure decides.
Disclaimer: This analysis is for educational purposes only and does not constitute investment advice. Please do your own research (DYOR) before making any trading decisions.

The Index nearing its supportNifty CMP 25230
Elliott- this is the bullish zig zag corrective pattern. The c wave is still not complete. Every c wave has its own 5 waves. Today's downfall is the iiird wave of c. So the Index may open in the green tom, only to close in the red.
Fibs- to me the fib zone at 25K is a high prob reversal zone. This is were the c wave should finish.
Conclusion - All in all we are nearing the end of the correction.

S&P 500: Late-Stage Structure Worth WatchingThe S&P 500’s recent advance is showing overlapping price action and narrowing ranges , raising the possibility of a developing Ending Diagonal near the highs.
Internally, the move lacks impulsive strength , with Wave (v) struggling for follow-through and RSI hovering around the mid-50s, suggesting momentum is not confirming price . This behavior is more typical of a terminal phase than a trend expansion.
That said, this is not a confirmed top . A break below the lower diagonal would support the bearish case, while strong acceptance above recent highs would invalidate the diagonal view.
For now, this remains a caution zone , not a conviction call.
Disclaimer: This analysis is for educational purposes only and does not constitute investment advice. Please do your own research (DYOR) before making any trading decisions.

Elliott Wave Analysis XAUUSD – January 20, 2026
1. Momentum
D1 Timeframe
– The D1 momentum has started to show signs of a bullish reversal. However, we still need to wait for today’s D1 candle close to fully confirm this reversal signal.
– If confirmed, the bullish trend is likely to continue.
– That said, since the reversal point is forming relatively close to the oversold zone, the upside potential of this move may be limited and expectations should be managed carefully.
H4 Timeframe
– H4 momentum is approaching the oversold area.
– If the current price action holds and we get a bullish H4 candle close, momentum will officially enter the oversold zone and may reverse upward.
– In that case, the bullish trend on the H4 timeframe will be reinforced.
H1 Timeframe
– H1 momentum is currently rising, indicating that the short-term bullish bias remains intact.
– Alternatively, price may continue to move sideways before a clearer direction emerges.
2. Elliott Wave Structure
D1 Wave Structure
– There is no major change in the D1 wave count.
– Price remains within the blue Wave 5.
– Combined with the emerging bullish reversal signal on D1 momentum, this suggests that Wave 5 may continue to extend higher.
H4 Wave Structure
– Within the blue Wave 5, the H4 structure consists of five yellow sub-waves.
– Price is currently moving inside yellow Wave 5.
– With H4 momentum preparing to reverse upward, yellow Wave 5 may continue its advance.
– However, special attention should be paid to the price channel: if price rises and then returns back inside the channel, it may signal that yellow Wave 5 has already completed.
H1 Wave Structure
– Inside yellow Wave 5, we can identify five purple sub-waves.
– At the moment, price is in the final stage of purple Wave 4 and preparing to enter purple Wave 5.
3. Targets & Key Price Zones
– Purple Wave 5 target: 4737
– From the Volume Profile, the 4641 – 4661 zone is a liquidity void (FVG).
– Price is currently being rejected from this area, indicating that 4661 is acting as a strong support level.
– By combining strong support from the FVG zone with H4 momentum approaching oversold and preparing for a bullish reversal, this area becomes a high-quality zone to look for Buy opportunities targeting the completion of Wave 5.
4. Trading Plan
– Buy Setup: 4667 – 4665
– Stop Loss: 4647
– Take Profit 1: 4687
– Take Profit 2: 4737

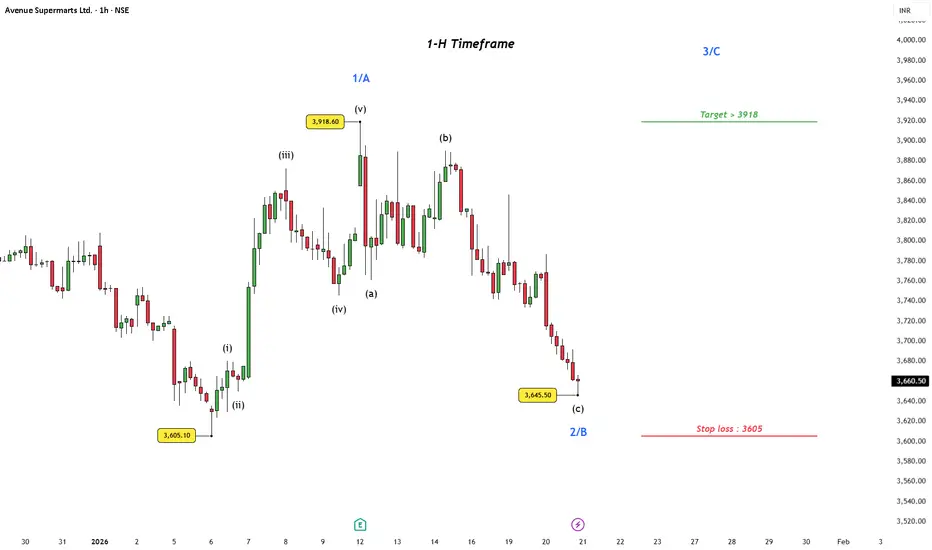
Avenue Supermarts(1-H): Structure Over NoiseToday’s price action was rough across Nifty and the broader market. But beneath the volatility, some charts are quietly holding their structure — and that’s worth paying attention to.
In Avenue Supermarts Ltd , price has unfolded a clean 5-wave advance on the 1-hour timeframe from the 3605.10 low to 3918.60 , allowing the move to be labeled as Wave 1 / A .
The subsequent decline shows a corrective ABC structure , with overlapping price action and weakening momentum — characteristics typical of a correction. The drop into 3645.50 fits well as wave b
, potentially completing Wave 2 / B .
At this point, confirmation of Wave 2 / B completion is still awaited . The bullish structure remains valid only if price continues to hold above 3605.10 on a closing basis . As long as this level is respected, the setup keeps the door open for a potential Wave 3 / C advance , with scope for a retest and possible extension beyond 3918 , offering a favorable reward-to-risk profile .
A decisive close below 3605.10 would invalidate this count and warrant a reassessment.
Disclaimer: This analysis is for educational purposes only and does not constitute investment advice. Please do your own research (DYOR) before making any trading decisions.
Very Short Term View for NiftyWrap up:-
Currently, Nifty is in final wave 5 which was started from 24337 on 08.08.2025. In the pattern of wave 5, Nifty is forming a wxy pattern. After break of 25318 cordinates of wxy has been changed. Now, Wave w has been completed at 26104 and wave x is expected to be completed at 25171 once nifty breaks and sustains above 25630. Thereafter, wave y is expected to be completed in the range of 26938-27355.
What I’m Watching for 🔍
Buy Nifty when it breaks and sustains above 25630 sl 25171 for a target of 26938-27355.
Disclaimer: Sharing my personal market view — only for educational purpose not financial advice.
"Don't predict the market. Decode them."

PCR Trading Strategies How to Trade Options
Many brokers today allow access to options trading for qualified customers. If you want access to options trading, you will have to be approved for both margin and options with your broker.
Once approved, there are four basic things you can do with options:
Buy (long) calls
Sell (short) calls
Buy (long) puts
Sell (short) puts

Very Short Term View for NiftyWrap up:-
Currently, Nifty is in final wave 5 which was started from 24337 on 08.08.2025. In the pattern of wave 5, Nifty is forming a wxy pattern. Wave w has been completed at 25448 and wave x at 25318 and wave y is expected to be completed in the range of 26630-26868.
In wave y, wave a is completed at 26325 and b is expected to be completed in the range of 25740- 25591; once Nifty breaks and sustains above 25909. Thereafter, Nifty will head towards wave c.
What I’m Watching for 🔍
Buy Nifty in the range of 25740-25591 or on safer side Buy Nifty when it breaks and sustains above 25909 sl 25508 (daily closing basis) for a target of 26630-26868.
Disclaimer: Sharing my personal market view — only for educational purpose not financial advice.
"Don't predict the market. Decode them."
