Thangamayil Jewellery Triangle Breakout in Daily TFThangamayil has confirmed a triangle breakout on the daily timeframe, indicating a shift from consolidation to expansion.
🔹 Breakout Level: 3,779
🔹 Upside Target / Next Supply Zone: 4,107
🔹 Key Support (Demand Zone): 3,140
The stock spent multiple sessions compressing within a Ascending triangle, forming higher lows — a classic sign of accumulation.
The breakout came with improved participation, suggesting buyers are gaining control.
As long as price sustains above the breakout zone, the structure remains bullish, and pullbacks may be viewed as retests rather than reversals.
A close back inside the pattern would weaken the breakout setup.
Company Overview
Thangamayil Jewellery Ltd is a well-known South India–focused jewellery retailer, primarily operating in Tamil Nadu.
The company specializes in gold, diamond, and silver jewellery, catering largely to wedding and festive demand.
With a strong regional brand presence and expansion into new stores, Thangamayil benefits from:
Consistent rural & semi-urban demand
High brand trust in South India
Seasonal tailwinds during festivals and marriage seasons
For analysis of any stock, feel free to comment the stock name below.
This analysis is for educational and informational purposes only. It does not constitute investment advice or a recommendation to buy or sell any security. Market investments are subject to risk, and past performance does not guarantee future results. Please consult a SEBI-registered financial advisor before making any investment decisions. The author is not responsible for any losses or gains arising from the use of this information.
Wave Analysis

Elliott Wave Analysis XAUUSD – 07/01/2025
1. Momentum
D1 Timeframe
– D1 momentum is currently approaching the overbought zone
– We need to wait for today’s D1 candle close for confirmation:
– Either momentum fully enters the overbought zone
– Or it starts to reverse to the downside
– We wait for the candle close to confirm the next signal
H4 Timeframe
– H4 momentum is currently declining
– This indicates that bearish momentum on the H4 timeframe is still dominant
– Main scenario: price continues to decline until H4 momentum reaches the oversold zone and shows a bullish reversal signal
H1 Timeframe
– H1 momentum is approaching the oversold zone
– There are signs of a potential bullish reversal
– In the short term, a technical rebound on the H1 timeframe is likely to occur
2. Elliott Wave Structure
D1 Timeframe
– The current structure is wave 2 or wave B of the purple wave Y
– The ongoing upward move is likely approaching completion
– This wave 2/B has a high probability of ending when D1 momentum confirms a bearish reversal
H4 Timeframe
– The wave 2 or wave B structure has already reached its valid target zone
– H4 momentum is declining
– Expectation: the top has likely been formed
– Main strategy: look for Sell opportunities on H1 pullbacks
H1 Timeframe
– The wave 2 or wave B structure is forming an ABC pattern (red)
– The current upward move is considered wave C of the corrective structure
– At the moment, a short-term bullish momentum move on H1 may occur; however, if H1 momentum reverses upward from the oversold zone while price fails to create a new high, this will provide additional confirmation that wave 2 or wave B has been completed
3. Price Zones & Technical Confluence
– Based on the Volume Profile, two high-liquidity zones have been identified, acting as strong resistance levels
4484 Zone
– A high-liquidity area
– Confluence with the 0.786 Fibonacci retracement of the previous 1–2–3–4–5 bearish wave
4521 Zone
– A high-liquidity area
– The target of the red wave C
– Wave C has a length equal to 1.618 times wave A
– These two zones are used as the primary Sell Zones
4. Trading Plan
Scenario 1
– Sell Zone: 4484 – 4486
– SL: 4501
– TP1: 4445
– TP2: 4398
– TP3: 4348
Scenario 2
– Sell Zone: 4520 – 4522
– SL: 4540
– TP1: 4445
– TP2: 4398
– TP3: 4348

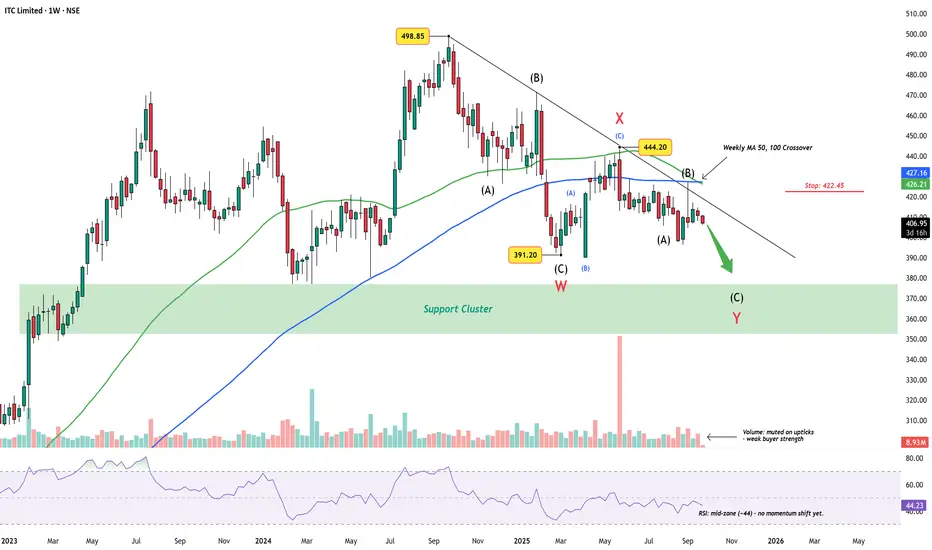
ITC Limited Weekly Chart – Wave Y Targets Support ClusterITC has been trending lower since the ₹498.85 peak, carving out what appears to be a complex W-X-Y correction. The first leg (W) found support near ₹391.20, followed by a corrective bounce into X at ₹444.20. The decline since then has kept price under a descending trendline, respecting the larger corrective rhythm.
Wave Count
Wave W: Completed into the ₹391.20 low.
Wave X: Counter-trend rally capped at 444.20.
Wave Y: Now unfolding, with sub-wave (C) still incomplete.
The broader structure hints that ITC may continue toward the support cluster (₹350–375) before this correction runs its course.
Indicators
Volume : Muted on upticks – rallies lack buying strength.
RSI (~44) : Mid-zone, leaving space for further downside before oversold conditions.
Weekly 50/100 MA crossover : Adds weight to the ongoing corrective bias.
Invalidation
A decisive break above ₹422.45 and sustained strength beyond 427 would question this bearish view, hinting at a possible shift back to bullish sequences.
Summary
Unless ITC reclaims higher ground above 422.45, the bias stays toward a Wave Y completion in the support cluster zone.
Disclaimer: This analysis is for educational purposes only and does not constitute investment advice. Please do your own research (DYOR) before making any trading decisions.
Part 12 Trading Master ClassOption Trading in the Indian Market
In India, the most actively traded options are:
NIFTY
BANKNIFTY
FINNIFTY
SENSEX
Stocks like Reliance, HDFC Bank, TCS, Infosys
Weekly expiries have increased retail participation significantly.

Yes Bank : Ready to reward you ~30% in a YearHi Friends,
Yes Bank looks promising now & ready for ~29% (Target ~30) upward journey.
I am anticipating the stock to start its upward journey.
Pattern : Beautiful inverse Head and shoulder is getting formed .
Entry point : Entry point is above YELLOW line.
Stoploss : Stoploss will be 10% below the YELLOW line
Timeline : ~01 Year
Targets, Stoploss & Entry are mentioned in the chart .
Please feel free to share your views regarding this chart & analysis .
Note : I am not a SEBI registered advisor . Please consider my analysis only for Education purpose .

Kalyan Jewellers – Elliott Wave analysis for breakout.Kalyan Jewellers – Elliott Wave Validation (Daily Chart, IST)
Big Picture Structure
• Primary trend: Bullish
• Current degree: Wave (5) in progress
• Wave (4): Completed near ₹440–445
• Market is now transitioning from early Wave (5) into impulsive expansion
________________________________________
Role of the Inverted Head & Shoulders (IH&S)
• IH&S has formed after Wave (4) → classic trend-resumption pattern
• This pattern is acting as:
o A reversal from correction
o A launchpad for Wave (5)
Key Pattern Levels
• Head: ~₹440–445 (Wave 4 low)
• Left Shoulder: ~₹495–505
• Right Shoulder: ~₹485–495
• Neckline: ~₹520–525
________________________________________
Breakout Condition (Critical Point)
If today’s candle closes 515 , it confirms breakout
More precisely:
• Daily close above ₹515 with volume
= Confirmed IH&S breakout
= Start of impulse inside Wave (5)
Projected Targets – Elliott-Compliant
Targets are valid Fibonacci expansions from Wave (4) low.
Reference Points
• Wave (4) low: ~₹445
• Breakout zone: ~₹525
🎯 Targets Explained
Target Basis
₹610 0.618 extension of Wave (5)
₹699 Equality with prior Wave (1) / mid expansion
₹799 1.618 extension → typical Wave (5) extreme
✔ All three targets are Elliott-legal and realistic
✔ ₹799 also aligns with previous Wave (3) high, which is common in Wave (5)

USDCAD – 15M | Breakout → Retest → Continuation SetupStrong impulsive move delivered a clean break in market structure to the upside.
Price pushed into buy-side liquidity, then paused at prior highs.
Key read:
Bullish displacement confirmed ✔️
Old resistance now acting as support ✔️
Pullback unfolding inside premium with inefficiency below

Nifty Analysis for Jan 07, 2026Wrap up:-
As updated earlier, wave c is an impulse wave with wave 1 at 26057, wave 2 at 25878, wave 3 at 26373 and wave 4 is expected to be completed in the range of 26212-26113. Thereafter, heading towards wave 5.
Now, wave 4 is completed at 26124 and heading towards final wave 5.
Buy Nifty @26124 sl 26113 (75 min. candle closing basis) for a target of 26544-26804.
Disclaimer: Sharing my personal market view — only for educational purpose not financial advice.
"Don't predict the market. Decode them."

Gold pauses; rotation, not continuation.🟡 XAUUSD – Intraday Smart Money Plan | by Ryan_TitanTrader (07/01)
📈 Market Context
Gold remains structurally bullish on higher timeframes, following a strong impulsive expansion that delivered price deep into premium. However, recent price action signals a transition from expansion into distribution, with Smart Money beginning to engineer corrective rotations rather than chasing continuation.
As the market digests USD flows, U.S. yield sensitivity, and positioning ahead of upcoming U.S. data, Gold is currently rotating between internal liquidity zones. This environment typically favors liquidity sweeps, inducement, and mean reversion, rather than clean directional breakouts.
Today’s session is best approached with level-based execution, patience, and confirmation — not prediction.
🔎 Technical Framework – Smart Money Structure (1H)
Current Phase:
HTF bullish structure with an active intraday corrective leg from premium.
Key Idea:
Expect Smart Money to react at internal supply (4428–4430) for short-term distribution, or at discount demand (4412–4410) for re-accumulation before the next leg.
Structural Notes:
• HTF bullish structure remains intact
• Clear BOS printed during the upside expansion
• Price rejected from premium and is rotating lower
• Internal supply at 4428–4430 acts as sell-sensitive zone
• Demand at 4412–4410 aligns with OB + EMA support + liquidity pocket
💧 Liquidity Zones & Triggers
• 🟢 BUY GOLD 4412 – 4410 | SL 4402
• 🔴 SELL SCALP 4428 – 4430 | SL 4438
🧠 Institutional Flow Expectation
Liquidity sweep → MSS / CHoCH → BOS → displacement → OB/FVG retest → expansion
🎯 Execution Rules
🟢 BUY GOLD 4412 – 4410 | SL 4402
Rules:
✔ Liquidity sweep into discount demand
✔ Bullish MSS / CHoCH on M5–M15
✔ Strong upside BOS with displacement
✔ Entry via refined bullish OB or FVG mitigation
Targets:
• 4425 — initial reaction
• 4435 — internal liquidity
• 4480–4500 — premium retest if momentum expands
🔴 SELL SCALP 4428 – 4430 | SL 4438
Rules:
✔ Price taps internal supply / EMA resistance
✔ Bearish MSS / CHoCH on lower timeframe
✔ Clear downside BOS confirming distribution
✔ Entry via bearish FVG refill or supply OB
Targets:
• 4418 — first imbalance
• 4410 — demand interaction
• Trail aggressively (scalp setup)
⚠️ Risk Notes
• Premium zones favor stop hunts and fake continuations
• Volatility may expand during U.S. session
• No entries without MSS + BOS confirmation
• Scalp sells require strict risk control
📍 Summary
Gold remains structurally bullish, but today’s edge lies in Smart Money’s intraday rotation:
• A sweep into 4412–4410 may reload longs toward premium, or
• A reaction at 4428–4430 offers a controlled scalp sell back into demand.
Let liquidity move first.
Let structure confirm second.
Smart Money engineers — patience profits. ⚡️
📌 Follow Ryan_TitanTrader for daily Smart Money gold breakdowns.

TCS 1 Week Time Frame 📊 Weekly Price Range & Levels
Current share price is trading around ₹3,250–₹3,280 (recent data).
Key Weekly Resistance
R3 / Upper resistance: ~₹3,382–3,383 (stronger barrier)
R2: ~₹3,335
R1: ~₹3,293–3,315 (first hurdle)
Interpretation:
If price breaks above ₹3,315–₹3,335, bulls may aim toward ₹3,380+ this week.
Key Weekly Support
S1: ~₹3,203–₹3,258 (primary support zone)
S2: ~₹3,155–₹3,236
S3: ~₹3,113–₹3,200 (deeper support)
Interpretation:
Holding above ₹3,200–₹3,203 is key for short‑term strength. A break below ₹3,155 could signal weakness and extend the slide.
🟡 Summary Weekly Levels
Level Price Zone (Approx)
Strong Resistance ₹3,350–₹3,382
First Resistance ₹3,293–₹3,315
Current Range ~₹3,250–₹3,280
Support 1 ₹3,203–₹3,258
Support 2 ₹3,155–₹3,236
Support 3 ₹3,113–₹3,200
✅ Trading takeaway:
Short‑term buyers may look for strength above ₹3,315–₹3,335 to target ₹3,380+.
On the downside, watch ₹3,200 — below that, deeper support zones near ₹3,155–₹3,113 come into play.

WIPRO 1 Week Time Frame 🔎 Current Market Price
Approx Current Price: ~₹265–₹272 per share (latest trading range) — price moving around mid‑260s.
📅 1‑Week Timeframe Key Levels
🔥 Resistance (Upside Targets)
Level Meaning
R1: ~₹273.8 First Weekly Resistance — immediate upside ceiling.
R2: ~₹278.7 Higher Weekly Resistance — breakout level for more bullish momentum.
R3: ~₹285.0 Extended Resistance — major top zone for the week if breakout happens.
🛡 Support (Downside Floors)
Level Meaning
S1: ~₹262.7 Immediate Weekly Support — key near‑term buying zone.
S2: ~₹256.4 Secondary Support — next lower cushion if price weakens.
S3: ~₹251.6 Major Weekly Support — broad downside safety zone for this week.
➡️ Weekly Trading Range (expected): ~₹251.6 — ₹285.0 depending on strength and volatility.
📊 What This Implies
📈 Bullish Scenario
Above ~₹273.8: break past this zone could open room toward ~₹278–₹285 resistance.
Bullish continuation may be confirmed if the stock closes the week above ₹278–279.
📉 Bearish Scenario
Below ~₹262.7: breakdown under this support can expose deeper support at ~₹256 and further near ~₹251.6.
A weekly close lower than key supports suggests range continuation or mild negative bias.

Profit with Options: Strategies, Principles, Practical Insights1. Understanding Options and Their Profit Potential
An option is a financial derivative that gives the buyer the right, but not the obligation, to buy or sell an underlying asset at a specific price (strike price) before or on a specified date (expiry).
Call options allow profits when the price of the underlying asset rises.
Put options allow profits when the price of the underlying asset falls.
Options profit potential comes from leverage. A relatively small investment (premium) can control a large value of the underlying asset. This leverage amplifies gains but also increases risk, making knowledge and planning essential.
2. Profit with Options in Bullish Markets
In bullish market conditions, traders expect prices to rise. Options offer multiple ways to profit from this expectation:
Buying Call Options: Profits increase as the underlying price rises above the strike price plus premium paid.
Bull Call Spreads: Buying a call at a lower strike and selling a call at a higher strike reduces cost and risk while capping profit.
Selling Put Options: Traders earn premium income if the asset stays above the strike price.
These strategies allow traders to benefit from upward movement with controlled risk compared to buying stocks outright.
3. Profit with Options in Bearish Markets
Options are equally effective in bearish conditions:
Buying Put Options: Profits grow as the underlying price falls below the strike price.
Bear Put Spreads: Lower cost strategies that limit both risk and reward.
Selling Call Options: Generates income if prices remain below the strike price.
This ability to profit in falling markets makes options especially attractive during economic slowdowns or market corrections.
4. Profit with Options in Sideways Markets
One of the biggest advantages of options is the ability to profit even when markets do not move significantly:
Option Selling Strategies: Selling calls or puts benefits from time decay (theta).
Iron Condors and Straddles: Designed to profit when prices remain within a defined range.
Calendar Spreads: Profit from differences in time decay between short-term and long-term options.
In range-bound markets, option sellers often have an edge due to the natural erosion of option value over time.
5. Role of Time Decay and Volatility
Two critical factors determine option profitability:
Time Decay (Theta): Options lose value as expiry approaches. Sellers benefit from this, while buyers must overcome it through strong price movement.
Volatility (Vega): Rising volatility increases option premiums, benefiting buyers. Falling volatility benefits sellers.
Understanding when to buy options (low volatility) and when to sell options (high volatility) significantly improves profit consistency.
6. Risk Management in Options Trading
While options offer high profit potential, risk management is crucial:
Always define maximum loss before entering a trade.
Use spreads instead of naked positions to limit downside.
Avoid over-leveraging capital in a single trade.
Maintain a proper risk-to-reward ratio, ideally risking less to gain more.
Professional option traders focus more on capital protection than aggressive profit chasing.
7. Profit with Options through Hedging
Options are widely used as insurance for portfolios:
Protective Puts safeguard long-term investments from sudden market crashes.
Covered Calls generate additional income on stock holdings.
Though hedging may reduce short-term profit, it stabilizes long-term returns and protects capital during market uncertainty.
8. Importance of Strategy Selection
There is no single best option strategy. Profitability depends on:
Market direction (bullish, bearish, neutral).
Volatility levels.
Time horizon.
Successful traders match strategies to market conditions rather than forcing trades. Discipline and patience often determine long-term success.
9. Psychology and Discipline in Options Profit
Options trading demands emotional control:
Avoid revenge trading after losses.
Stick to predefined rules and strategies.
Accept that losses are part of the process.
Consistent profits come from process-driven trading, not impulsive decisions.
10. Long-Term Perspective on Option Profits
Options are not a get-rich-quick tool. Sustainable profits come from:
Continuous learning and practice.
Back-testing strategies.
Adapting to changing market dynamics.
Traders who treat options as a professional skill rather than speculation tend to achieve long-term profitability.
Conclusion
Profit with options is achievable across all market conditions when approached with knowledge, discipline, and proper risk management. Options provide flexibility unmatched by other instruments, allowing traders to design strategies tailored to their market outlook and risk appetite. By understanding option mechanics, leveraging time decay and volatility, applying disciplined strategies, and managing risk effectively, traders can convert options into a consistent and powerful profit-generating tool in the financial markets.

Risk Management in Trading: How to Avoid Big Trading LossesUnderstanding Risk in Trading
Risk in trading refers to the possibility of losing part or all of your invested capital due to adverse market movements. Every trade carries uncertainty because markets are influenced by countless factors such as economic data, global events, institutional activity, and market psychology. A trader who ignores this uncertainty often overexposes themselves, leading to large and sometimes irreversible losses. Recognizing that risk is unavoidable is the first step toward controlling it.
Capital Preservation Comes First
The primary goal of risk management is capital preservation. If you lose a large portion of your trading capital, it becomes mathematically harder to recover. For example, a 50% loss requires a 100% gain just to break even. This is why professional traders prioritize protecting their capital over chasing profits. Staying in the game is more important than making quick money.
Position Sizing: The Core of Risk Control
One of the most effective tools in risk management is proper position sizing. Position sizing determines how much capital you allocate to a single trade. A common rule followed by disciplined traders is risking only 1–2% of total trading capital on any single trade. This means that even if several trades fail consecutively, the overall damage to the account remains manageable. Proper position sizing ensures that emotions remain under control and trading decisions stay rational.
Use of Stop-Loss Orders
Stop-loss orders are essential for avoiding big losses. A stop-loss defines the maximum loss you are willing to accept on a trade before entering it. Without a stop-loss, traders often fall into the trap of holding losing positions, hoping the market will reverse. This behavior can turn small losses into devastating ones. A predefined stop-loss enforces discipline and removes emotional decision-making during volatile market conditions.
Risk-Reward Ratio Matters
A favorable risk-reward ratio is a key principle of long-term profitability. This ratio compares the potential loss of a trade to its potential gain. For example, risking ₹1 to make ₹2 gives a 1:2 risk-reward ratio. Even if you are right only 40–50% of the time, a good risk-reward structure can keep you profitable. Traders who accept large risks for small rewards often face consistent losses despite a high win rate.
Avoid Overtrading
Overtrading is one of the most common causes of large trading losses. It occurs when traders take too many trades due to boredom, revenge trading after losses, or the fear of missing out (FOMO). Each trade carries risk, and excessive trading increases exposure unnecessarily. A well-defined trading plan with strict entry criteria helps reduce overtrading and improves overall performance.
Diversification and Market Selection
Putting all your capital into one asset, one sector, or one type of trade increases risk significantly. Diversification helps spread risk across different instruments or strategies. While diversification does not eliminate losses, it reduces the impact of a single adverse event. At the same time, traders should avoid over-diversification, which can dilute focus and lead to poor execution.
Emotional Discipline and Psychology
Emotions such as fear, greed, hope, and frustration are major contributors to big trading losses. Fear can cause premature exits, while greed can lead to oversized positions. Revenge trading after a loss often results in even bigger losses. Strong risk management rules act as a psychological safety net, helping traders stay calm and disciplined regardless of market conditions.
Leverage: A Double-Edged Sword
Leverage allows traders to control larger positions with smaller capital, but it also magnifies losses. Many traders blow their accounts by misusing leverage. High leverage combined with poor risk management can wipe out an account in minutes. Sensible use of leverage, aligned with strict stop-losses and position sizing, is essential to avoid catastrophic losses.
Adapting to Market Conditions
Markets are dynamic, and risk levels change with volatility. During high-volatility periods such as major news events or earnings announcements, price swings can be unpredictable. Reducing position size or staying out of the market during such times is a smart risk management decision. Flexibility and adaptability are crucial traits of successful traders.
Keep a Trading Journal
A trading journal is a powerful tool for improving risk management. By recording entry reasons, position size, stop-loss levels, emotions, and outcomes, traders can identify patterns that lead to losses. Over time, this self-analysis helps refine strategies, eliminate costly mistakes, and strengthen discipline.
Consistency Over Perfection
Many traders aim for perfect entries and high win rates, but consistency is far more important. A trader who follows risk management rules consistently will outperform a trader who occasionally makes big gains but suffers massive losses. Small, controlled losses are part of the trading process and should be accepted without emotional distress.
Long-Term Perspective
Risk management encourages a long-term mindset. Instead of focusing on daily profits or losses, traders should evaluate performance over a series of trades. This approach reduces emotional pressure and promotes logical decision-making. Successful trading is a marathon, not a sprint.
Conclusion
Avoiding big trading losses is not about predicting the market with absolute accuracy; it is about managing risk intelligently. Proper position sizing, disciplined use of stop-losses, favorable risk-reward ratios, emotional control, and capital preservation form the foundation of effective risk management. Traders who respect risk survive market downturns, learn from mistakes, and compound their capital steadily over time. In trading, protecting what you have is the first step toward achieving what you want.

Understanding Market Structure Through Traded VolumeVolume Profile Analysis is a powerful market analysis technique that focuses not on time, but on price and volume interaction. Unlike traditional volume indicators that show how much volume was traded during a specific time period, volume profile reveals where trading activity was concentrated across different price levels. This makes it an essential tool for traders and investors who want to understand market structure, identify high-probability trade zones, and align themselves with institutional activity.
At its core, volume profile answers one crucial question: At which prices did the market accept value, and at which prices did it reject value? Understanding this distinction helps traders make better decisions about entries, exits, and risk management.
1. What Is Volume Profile?
Volume Profile is an advanced charting tool that displays a horizontal histogram on the price axis. This histogram shows the amount of volume traded at each price level over a selected period. Instead of vertical bars representing volume over time, volume profile shifts the focus horizontally, offering a clearer picture of price acceptance and rejection.
This tool is widely used by professional traders, proprietary desks, and institutions because it reflects real participation, not just price movement. Markets can move rapidly with low volume, but such moves are often unreliable. Volume profile helps traders identify where strong participation occurred and where moves lack conviction.
2. Key Components of Volume Profile
Volume profile is built around a few critical concepts that every trader must understand:
Point of Control (POC)
The POC is the price level where the highest volume was traded during the selected period. It represents the fairest price where buyers and sellers agreed most. Markets tend to gravitate toward the POC because it reflects balance and consensus.
Value Area (VA)
The value area is the price range where approximately 70% of total traded volume occurred. It is divided into:
Value Area High (VAH)
Value Area Low (VAL)
Prices inside the value area represent acceptance, while prices outside it indicate rejection or imbalance.
High Volume Nodes (HVN)
HVNs are price levels with heavy trading activity. They act as strong support or resistance zones because many positions are built there.
Low Volume Nodes (LVN)
LVNs are price levels with little trading activity. Price moves quickly through these areas, making them ideal for breakouts or fast directional moves.
3. Why Volume Profile Is Important
Volume profile gives traders a three-dimensional view of the market. While price shows direction and indicators show momentum, volume profile shows market intent.
Its importance lies in:
Identifying institutional accumulation and distribution
Filtering false breakouts
Understanding true support and resistance
Improving trade timing and accuracy
Enhancing risk-reward ratios
Markets are driven by large participants. Volume profile helps retail traders align with these larger forces instead of trading blindly based on indicators.
4. Market Phases Through Volume Profile
Volume profile clearly reveals different market phases:
Balanced Market (Range-Bound)
In balanced conditions, the profile is wide and bell-shaped. The POC remains stable, and price oscillates within the value area. Range trading strategies work best here.
Imbalanced Market (Trending)
In trending conditions, the profile shifts upward or downward, forming elongated shapes. The POC migrates in the direction of the trend, confirming strength.
Transition Phase
When price moves outside the value area and builds volume at new levels, the market transitions into a new balance. This phase often offers the best trading opportunities.
5. Using Volume Profile for Support and Resistance
Traditional support and resistance lines are subjective. Volume profile offers objective levels based on actual traded volume.
HVNs act as strong support/resistance zones.
VAH and VAL often behave like dynamic resistance and support.
POC works as a magnet price, pulling price back during consolidation.
These levels are more reliable than trendlines because they reflect real market participation.
6. Breakout and Rejection Analysis
Volume profile is highly effective in distinguishing real breakouts from fake ones.
A breakout above VAH with strong volume acceptance indicates trend continuation.
A move above VAH followed by quick rejection back into the value area signals a false breakout.
LVNs above or below value areas often become breakout targets.
This ability to read acceptance versus rejection makes volume profile invaluable for intraday, swing, and positional traders.
7. Entry and Exit Strategy Using Volume Profile
Traders can use volume profile to refine entries and exits:
Entries
Buy near VAL in an uptrend
Sell near VAH in a downtrend
Enter breakouts from LVNs with confirmation
Exits
Partial profits near POC or HVNs
Full exits near opposite value area boundaries
Trail stops beyond low-volume zones
This structured approach improves consistency and reduces emotional trading.
8. Volume Profile Across Timeframes
Volume profile works across all timeframes:
Intraday traders use session volume profiles
Swing traders use weekly or monthly profiles
Investors analyze long-term composite profiles
Higher timeframe volume levels always carry more weight and should be respected even when trading lower timeframes.
9. Combining Volume Profile with Other Tools
Volume profile is most effective when combined with:
Price action
Market structure
VWAP
Trend analysis
Candlestick patterns
It should not be used in isolation. Instead, it acts as a context tool, helping traders understand where trades make sense and where they do not.
10. Common Mistakes in Volume Profile Analysis
Many traders misuse volume profile by:
Ignoring market context
Overloading charts with multiple profiles
Trading every LVN without confirmation
Treating POC as a guaranteed reversal level
Discipline and proper interpretation are essential to extract its full potential.
11. Psychological Edge of Volume Profile
Volume profile enhances trading psychology by:
Providing clear reference levels
Reducing guesswork
Increasing confidence in trade decisions
Encouraging patience and discipline
When traders understand where value lies, they stop chasing price and start trading with logic.
12. Conclusion
Volume Profile Analysis is one of the most insightful tools for understanding market behavior. By focusing on where volume is traded rather than when, it reveals the true structure of the market. It helps traders identify value, spot institutional activity, and distinguish between genuine moves and false signals.
For traders seeking consistency, clarity, and a deeper understanding of price action, volume profile is not just an indicator—it is a framework for thinking about markets. Mastery of volume profile can significantly elevate trading performance when combined with sound risk management and disciplined execution.

A Step-by-Step Guide to Efficient and Disciplined TradingSimple Trade Execution:Below is a detailed point-wise explanation (approximately 1000 words) that clearly explains the concept of simple trade execution, suitable for beginners as well as intermediate traders.
1. Meaning of Simple Trade Execution
Simple trade execution refers to the process of entering, managing, and exiting a trade in the financial markets using clear, predefined, and easy-to-follow rules.
It focuses on clarity, discipline, and consistency, rather than complex strategies or excessive indicators.
The goal is to reduce emotional decision-making and execution errors.
2. Importance of Trade Execution in Trading
Even the best trading strategy fails if execution is poor.
Proper execution ensures that trades are placed at the right price, time, and quantity.
Slippage, delays, and emotional reactions can significantly reduce profitability.
Simple execution helps traders remain focused and calm during volatile market conditions.
3. Clear Trading Plan as the Foundation
Simple execution begins with a well-defined trading plan.
The plan must include:
Entry criteria
Exit criteria
Stop-loss rules
Position size
Without a plan, execution becomes random and inconsistent.
4. Identifying the Trade Setup
A trade setup is the condition under which a trader decides to enter a trade.
Simple setups may include:
Support and resistance levels
Trend continuation patterns
Breakouts with confirmation
Avoid over-analyzing multiple indicators; clarity improves execution speed.
5. Entry Execution Rules
Entry should be rule-based, not emotional.
Use limit orders or market orders depending on liquidity and volatility.
Enter only when price reaches your predefined level.
Avoid chasing price, as it leads to poor risk-reward outcomes.
6. Choosing the Right Order Type
Market Order: Executes immediately at the current price.
Limit Order: Executes at a specified price or better.
Stop Order: Activates when price reaches a certain level.
Simple traders prefer limit and stop orders to control execution price.
7. Position Sizing for Simple Execution
Position size determines how much capital is allocated to a trade.
A simple rule is to risk only 1–2% of total capital per trade.
Proper sizing ensures emotional stability and long-term survival.
Oversized positions lead to panic and poor execution.
8. Importance of Stop-Loss Placement
Stop-loss protects capital from unexpected market moves.
It should be placed at a logical technical level, not randomly.
Always place stop-loss at the time of trade entry.
Simple execution treats stop-loss as non-negotiable.
9. Risk-Reward Ratio
Simple trade execution focuses on favorable risk-reward ratios.
A common minimum ratio is 1:2 (risk 1 unit to gain 2 units).
High win rates are not necessary if risk-reward is disciplined.
This simplifies decision-making and execution.
10. Trade Confirmation Before Execution
Confirm trades using one or two factors only.
Examples:
Price action near key levels
Volume confirmation
Avoid conflicting signals, which delay execution and create doubt.
11. Timing the Market Entry
Timing matters, but perfection is not required.
Execute trades during high-liquidity sessions for better fills.
Avoid trading during major news releases unless planned.
Simple timing rules reduce execution stress.
12. Avoiding Overtrading
Simple execution emphasizes quality over quantity.
Too many trades increase costs and execution mistakes.
Trade only when setup matches your plan exactly.
Patience is a key execution skill.
13. Managing the Trade After Entry
Once entered, avoid unnecessary interference.
Follow predefined rules for trailing stop-loss or partial exits.
Do not move stop-loss emotionally.
Let the trade play out according to the plan.
14. Exit Execution Strategy
Exit is as important as entry.
Simple exit methods include:
Fixed target exit
Trailing stop exit
Time-based exit
Choose one method and apply it consistently.
15. Handling Losing Trades
Losses are a normal part of trading.
Simple execution accepts losses without emotional reaction.
Do not revenge trade or increase position size after a loss.
Focus on executing the next trade correctly.
16. Handling Winning Trades
Avoid greed after winning trades.
Stick to your exit plan even if market moves further.
Consistency matters more than maximizing every trade.
Simple execution values repeatable profits.
17. Emotional Discipline in Execution
Fear causes early exits; greed causes late exits.
Simple rules remove emotional conflict.
Use checklists before executing trades.
Discipline is built through repetition and journaling.
18. Role of Trading Journal
Maintain a record of executed trades.
Note entry, exit, stop-loss, and emotions.
Review execution mistakes regularly.
Continuous improvement depends on self-analysis.
19. Technology and Execution Speed
Use a reliable trading platform.
Ensure stable internet connection.
Avoid placing trades during platform glitches.
Simple execution requires minimal but reliable tools.
20. Avoiding Common Execution Mistakes
Entering without confirmation
Ignoring stop-loss
Changing plan mid-trade
Trading due to boredom
Overleveraging capital
21. Importance of Routine
Follow a fixed daily trading routine.
Analyze market, execute trades, review performance.
Routine improves execution consistency.
Simplicity thrives on structure.
22. Scalping vs Swing Execution Simplicity
Scalping requires faster execution and higher focus.
Swing trading allows slower, calmer execution.
Beginners benefit more from swing-based simple execution.
Choose style that matches your personality.
23. Capital Preservation Focus
Simple execution prioritizes survival over profits.
Protecting capital ensures long-term participation.
Consistent small gains outperform inconsistent large gains.
Risk control is the core of execution simplicity.
24. Learning Through Repetition
Execution skill improves with practice.
Paper trading helps refine execution without risk.
Gradual transition to real capital builds confidence.
Keep rules unchanged during learning phase.
25. Conclusion: Power of Simple Trade Execution
Simple trade execution is about doing fewer things correctly.
It removes complexity, emotion, and confusion.
Long-term success depends more on execution than strategy.
Consistency, discipline, and clarity are the true edge in trading.

SUNPHARMA in uptrend on 4 hour timeframeSunpharma seems to have completed ABC correction and now entering into an upward wave.
CMP -> 1740
SL -> 1700
Tgt1 -> 1790
Will keep you guys posted in case there is any change
HAPPY TRADING!

HDFCBANK — 1H Technical Analysis
Timeframe: 1 Hour
Structure: Intermediate ABC correction within a broader uptrend
Current Price Zone: ~₹963
Trend Context: Higher-timeframe trend remains positive, short-term corrective phase in progress
🔍 Market Structure & Price Action (Educational View)
Price is currently forming an Intermediate corrective ABC structure after facing rejection near the ₹1,018–1,020 resistance band.
Wave (a): Sharp impulsive decline from the top
Wave (b): Retracement toward resistance, failed to make a new high
Wave (c): Ongoing decline, approaching a high-probability demand zone
This is a classic corrective pause, not a trend reversal unless key supports fail.
📌 Key Levels to Track
Major Resistance: ₹1,018–1,020
Reclaim Level (Trend Continuation): ₹975–980
ABC Completion / Demand Zone: ₹961–965
Critical Invalidation Level: ₹957
Breakdown Support (Risk Zone): ₹916
💡 Corrections often end where institutions previously accumulated — zones matter more than candles.
🟢 Bullish Scenario (Primary Plan)
If price holds above ₹961–965 and shows stabilization:
Confirmation signals to watch:
Bullish engulfing / strong rejection wick
Higher low on 15m–1h
Volume expansion on green candles
Upside Roadmap:
₹975 → ₹990 → ₹1,010
Sustained move above ₹980 opens doors for fresh highs over time
📘 This would confirm ABC completion and resumption of the larger uptrend.
🔴 Bearish Scenario (Risk Case)
If price breaks and sustains below ₹957:
ABC structure fails
Selling pressure may accelerate
Downside opens toward ₹930 → ₹916
📉 Below ₹957, probabilities shift from “buy-the-dip” to “protect capital”.
🎓 Educational Takeaways
Corrections are healthy pauses, not immediate sell signals
Always trade levels + confirmation, not hope
Bigger trend remains intact above ₹957
Sideways + choppy price = option sellers’ playground
🧠 Options Trading Strategies (Educational Only)
🟢 Bullish (Support Holds)
Strategy 1: Bull Call Spread
Buy ATM Call
Sell OTM Call (₹980/₹1000 zone)
Defined risk, lower theta decay
Strategy 2: Cash-secured Put (Aggressive)
Sell ₹960 PE only if price stabilizes
Suitable for experienced traders
🔴 Bearish (Support Breaks)
Strategy 1: Bear Put Spread
Buy ₹960 PE
Sell ₹920 PE
Risk-defined downside play
Strategy 2: Call Credit Spread
Sell ₹980 CE
Buy ₹1020 CE
Works best in breakdown + consolidation
⚠️ Avoid naked options near support zones.
✅ DOs
✔ Trade near key levels, not in the middle
✔ Use defined SL (₹957)
✔ Reduce position size during corrections
✔ Wait for price confirmation
❌ DON’Ts
❌ Don’t panic sell near demand zones
❌ Don’t over-leverage options during volatility
❌ Don’t assume every dip is a buying opportunity
❌ Don’t ignore higher-timeframe trend context
🧾 Summary & Conclusion
HDFC Bank is undergoing a controlled intermediate correction within a broader bullish structure.
The ₹961–965 zone is crucial — holding above this keeps the bullish roadmap intact, while a breakdown below ₹957 increases downside risk.
📌 Patience + confirmation = edge.
⚠️ Disclaimer
This analysis is for educational purposes only. I am not a SEBI registered analyst. Markets are risky, and I may be wrong. Please consult your financial advisor before taking any trade.

Reliance ending diogonal in wave 5Reliance Industries Limited – Ending Diagonal in Wave (5) | Structure from April 2025
The advance in Reliance from the April 2025 low has unfolded as a clear impulsive structure. With Wave (1) through Wave (4) in place, the ongoing rise appears to be Wave (5) of the larger sequence.
The internal structure of the current leg shows overlapping price action within a rising wedge, indicating a fifth-wave ending diagonal:
Overlapping sub-waves
Loss of upside momentum near highs
Price respecting diagonal trendline boundaries
These characteristics typically appear at the terminal stage of a trend. If this interpretation is correct, Wave (5) is either complete or in its final phase.
A decisive breakdown below the lower diagonal boundary would confirm the end of Wave (5) and signal the start of a corrective ABC phase.
Key takeaways:
Ending diagonals imply trend exhaustion, not strength
Risk increases for fresh longs at this stage
Post-diagonal corrections are usually swift and deep


NIFTY : Trading plan for 07-Jan-2026
(Timeframe: 15-min | Gap consideration: 100+ points)
Key Levels to Track (from chart)
Upper Resistance / Extension: 26,392
Last Intraday Resistance: 26,320
Opening Resistance (Gap-up case): 26,250
Opening Support / Resistance (Pivot): 26,183 – 26,175
Opening Support (Gap-down case): 26,042 – 26,080
Last Intraday Support: 25,983
Lower Extreme Support: 25,839
🧠 Context: After a strong prior up-move, price corrected and is now hovering near a pivot band (26,183–26,175). Expect whipsaws early; clean direction needs acceptance above/below the pivot.
🟢 1. GAP-UP OPENING (100+ Points)
If NIFTY opens above 26,250, the market signals bullish intent but immediately faces overhead supply.
🎓 Educational Explanation:
Gap-ups near resistance often see early profit booking. Sustainable upside requires price acceptance (holding above levels on a 15-min close), not just a spike.
Plan of Action:
Avoid the first 10–15 mins; let volatility settle.
Sustain above 26,250 → test 26,320 (last intraday resistance).
Acceptance above 26,320 opens path toward 26,392.
Repeated rejection near 26,320 → expect pullback toward 26,250 → 26,183.
Options idea: Bull Call Spread (ATM buy + OTM sell) to reduce theta risk near resistance.
🟡 2. FLAT OPENING
If NIFTY opens inside 26,175–26,250, expect a range-bound start.
🎓 Educational Explanation:
Flat opens inside a pivot zone reflect indecision. Direction emerges only after a range expansion with volume.
Plan of Action:
Above 26,250 → bullish bias toward 26,320.
Failure at 26,250 keeps price rotating within 26,183–26,175.
Break & hold below 26,175 shifts bias toward 26,080 → 26,042.
Wait for 15-min close + volume before committing.
Options idea: Iron Fly / Narrow Strangle (light size) if range persists.
🔴 3. GAP-DOWN OPENING (100+ Points)
If NIFTY opens below 26,175, sentiment turns cautious.
🎓 Educational Explanation:
Gap-downs into support can trigger panic selling, followed by either short covering or continuation. Confirmation matters.
Plan of Action:
First watch zone: 26,080–26,042.
Sustain below 26,042 → downside toward 25,983.
Break of 25,983 increases probability of 25,839.
Strong bullish rejection from 26,080–26,042 may offer intraday bounce longs.
Options idea: Bear Put Spread (avoid naked puts near supports).
⚙️ Risk Management Tips for Options Trading 🛡️
Risk only 1–2% of capital per trade.
Prefer spreads near major levels to manage theta & IV.
Use time-based exits if premium stalls for 15–20 mins.
Book partials early; trail the rest.
No revenge trades after SL.
🧾 Summary & Conclusion
Above 26,250: Bulls active; hurdles at 26,320 → 26,392
26,175–26,250: Choppy pivot → patience pays
Below 26,175: Weakness toward 26,080 → 26,042 → 25,983
Trade reaction at levels, not predictions 🚦
⚠️ Disclaimer
I am not a SEBI-registered analyst. This content is for educational purposes only. Markets involve risk—consult your financial advisor before trading.


Difference btw Beginner, Pro and Full time Traders ( Mtfa view )In this Big 20 minutes video, I will try to explain the most beautfull conept of Multi time frame analysis from the perspective of 4 different types of trader .
Charts used are older than 3 months
