Abstract
Uranium(VI) speciation in aqueous carbonate solutions was systematically investigated using time-resolved laser-induced fluorescence spectroscopy (TRLFS) across a broad pH range (4.3–13.0) at room temperature. Distinct uranyl complexes were identified based on their luminescence lifetimes and emission spectra, and their formation was correlated with the theoretical speciation models. Particular emphasis was placed on alkaline conditions, where uranium speciation is less understood due to weak luminescence signals. This study revealed the presence of multiple hydroxo and carbonato complexes, including non-luminescent species at high pH. These findings provide new insights into uranium(VI) behaviour in cementitious environments relevant to deep geological repositories. Moreover the dynamics of complex formation were investigated, and the quantity of precipitates were quantified using the methods based on the luminescent properties of uranium and the presence of a complexing agent. The luminescence intensity was shown to be independent of pH and linearly correlated with uranium concentration, confirming TRLFS as a robust tool for uranium quantification in variable geochemical settings. This work contributes to a more accurate understanding of uranium mobility and stability in nuclear waste management scenarios and in locations contaminated with elevated uranium levels as a resulting of ore extraction or processing.
Original content from this work may be used under the terms of the Creative Commons Attribution 4.0 licence. Any further distribution of this work must maintain attribution to the author(s) and the title of the work, journal citation and DOI.
1. Introduction
Uranium is a heavy element ubiquitous in all environmental media. It is naturally occurring, and naturally radioactive [1]. Although uranium can exist in oxidation states ranging from 2+ to 6+, U(IV), which is typically immobile, is most commonly found in its reduced state. In contrast, a more soluble and mobile state, U(VI), is frequently observed [2]. The oxidation and subsequent chemical alteration of primary uranium ores frequently result in the formation of U(VI) mineral compounds, including vanadates, phosphates, and silicates. Groundwater interactions and weathering processes are key factors contributing to the migration of uranium from deposits into the biosphere. Sandstone and permeable sedimentary rocks are particularly vulnerable to leaching from groundwater, while bedding planes and structural features such as fractures and faults in less permeable rocks also provide pathways for groundwater transport [3].
The concentration of uranium in common rock types ranges from 0.5 to 4.7 mg·kg−1, with an average crustal abundance of ∼2.7 mg·kg−1. Alkaline rocks generally have lower concentrations of uranium, while acidic rocks are usually associated with higher levels. Moreover, uranium is commonly found in sources such as lignite, monazite sands, and phosphate rock. In soil, uranium can occur in multiple forms which can be bound organically, sorbed or in precipitated states. Its retention in soil may be attributed to various processes, including binding to organic matter into various complexes, absorption by microbial mass, alternating precipitation and dissolution, ion exchange, adsorption, chemisorption, etc [4, 5].
The reliance on nuclear energy (e.g. through the fission of 235U) is a significant aspect of modern life. However, uranium mining and nuclear fuel processing also have significant environmental impacts on both human and non-human biota [5]. Moreover, uranium commonly co-occurs with other economically significant ores, such as gold, silver, bismuth and others which can influence both its extraction and environmental behavior. The environmental challenges associated with former mining operations and areas assessed for their mining potential include issues such as spoil heaps from discarded overburden and low-grade ore, uranium mill tailings that present long-term management challenges, waste from heap leaching operations, water treatment sludges containing potentially hazardous substances, and acid mine drainage that contaminates surface and groundwater. Additionally, local contamination may affect soils and nearby residences, while abandoned mine shafts, adits, and processing equipment pose safety risks [4].
In addition, other parts of the nuclear fuel cycle also pose some risk of releasing radionuclides into the environment. At the end of its operational life, spent nuclear fuel (SNF) is classified as high-level radioactive waste (HLW). A small fraction of HLW is reprocessed, while the majority is stored in temporary facilities. Another preferred option within the closed fuel cycle are deep geological repositories (DGRs) designated for its long-term management of SNF. Given that SNF constitutes the largest portion of HLW, safety is paramount in the operation of such facilities. The primary objective of a DGR is to securely contain radioactive materials for extended periods. To achieve this, DGRs are equipped with multiple barriers that impede the movement of radionuclides into the geological formation and, subsequently, into the environment [6–9].
The transport of radionuclides through these barriers is largely described by sorption and computational models, such as PHREEQC, ORCHESTRA, CrunchFlow, and iCP [9–11]. It is important to note that research in this field is ongoing, and real data from long-term experiments, including mock-up studies, are continually being gathered [12, 13].
Water is a critical medium that can lead to the corrosion of storage containers, potentially allowing radionuclides to migrate into the biosphere [6, 14]. To accurately model the processes occurring within these barriers, it is essential to understand the speciation of radionuclides. Uranium, the predominant element in spent nuclear fuel within DGRs, exhibits varying mobility through the barrier system depending on the surrounding conditions and its speciation. Various analytical techniques (such as ion exchange chromatography, electrophoresis, stripping voltammetry, sequential extraction, diverse filtration methods, dialysis, and X-ray photoelectron spectroscopy) and computational methods can be employed to determine uranium speciation [14]. Furthermore, uranium and elements found in spent nuclear fuel exhibit luminescent properties following excitation due to neutron activation. For example, among the lanthanides, Sm, Eu, Tb, and Dy exhibit fluorescence. Similarly, from the actinide series, Pa, Np, Pu, Am, and Cm also demonstrate fluorescent properties. Consequently, time-resolved laser-induced fluorescence spectroscopy (TRLFS) can be employed to investigate their complexation behaviour, which plays a crucial role in determining their mobility in aquatic environments. Under appropriate conditions, laser-induced luminescence measurements also allow the quantification of their concentrations in liquid samples.
TRLFS enables the identification of individual species by analysing their luminescence lifetimes and spectral features. Each species exhibits a distinct emission profile, characterized by characteristic spectral shapes and decay kinetics, which reflect the interactions between the central atom and its coordinating ligands. Furthermore, when an appropriate complexing agent is used, TRLFS can facilitate the detection of ultra-trace concentrations.
1.1. Advantages of TRLFS for uranium analysis
- High sensitivity and selectivity. TRLFS offers exceptional sensitivity, enabling the detection of luminescent species at trace concentrations. Compared to other analytical techniques, it provides superior selectivity, particularly for uranium(VI), making it highly suitable for analysing complex environmental or geological samples with low analyte levels [15].
- Temporal resolution for speciation analysis. TRLFS distinguishes luminescence signals based on their decay lifetimes, allowing for the separation and identification of multiple fluorescent species within a mixture. This capability is particularly advantageous in complex matrices (e.g., environmental samples or nuclear waste), where multiple components coexist and interact [15].
- Background suppression via time-gated detection. By introducing a controlled delay between excitation and detection, TRLFS suppresses short-lived background signals (e.g., scattered light and prompt fluorescence from matrix components). This time-gated approach significantly enhances the signal-to-noise ratio, improving the accuracy of species identification and quantification, even in optically complex samples.
- Molecular and environmental insights. TRLFS provides valuable information about the local chemical environment of luminophores, including pH, ionic strength, and the presence of quenching agents.
These insights are critical for understanding complexation behaviour and molecular interactions in solution [16, 17]. Extensive TRLFS investigations of uranium(VI) complexes have predominantly focused on acidic to neutral pH ranges [18–24]. However, to our knowledge, no study has comprehensively addressed uranium(VI) speciation across the alkaline pH range with sufficient consistency or under comparable experimental conditions. Existing studies often present conflicting results or provide only partial insights, lacking a systematic approach. For example, significant variations in the luminescence lifetimes of specific uranium(VI) species have been reported in [19, 25, 26], but methodological discrepancies among these studies hinder meaningful comparisons and the drawing of reliable conclusions.
Additionally, under alkaline conditions at room temperature, the luminescence of dominant uranyl species is typically weak, contributing to the scarcity of published studies in this pH regime [21, 23]. This highlights a significant gap in the current understanding of uranium(VI) speciation in high-pH environments.
The present study addresses this gap by investigating uranium speciation in aqueous solutions that simulate alkaline conditions relevant to cementitious environments in deep geological repositories. In this study we aimed to elucidate much wider environmental dimension of TRFLS. Using TRLFS, we acquired comprehensive across a broad pH range (4.3–13.0), enabling the characterization of uranium(VI) complexes under model conditions representative of long-term nuclear waste repositories. The novelty of this work lies in its systematic, high-resolution investigation across a broad alkaline pH range (up to pH 13) under both inert (CO2-free) and atmospheric conditions, allowing for direct comparison and identification of species, including the potential new complex [(UO2)4(OH)7]+, that are critical for accurately modeling uranium behavior in cementitious nuclear waste repository environments. At the same time, it provides insights into the dynamics of complex formation and precipitation, with the quantity of precipitates being quantitatively assessed.
2. Methods
2.1. Theory
2.1.1. The spectroscopic properties of uranium
In speciation studies using TRLFS, different chemical species of an element exhibit distinct luminescence spectra—resulting from radiative relaxation between energy states—and varying mean luminescence lifetimes (LL). The position of the spectral maximum differs among species, reflecting fundamental differences in their electronic energy states. Thus, the luminescence spectrum along with the LL, serves as a unique identifier for each species [27–29].
2.1.1.1. Uranyl ion luminescence
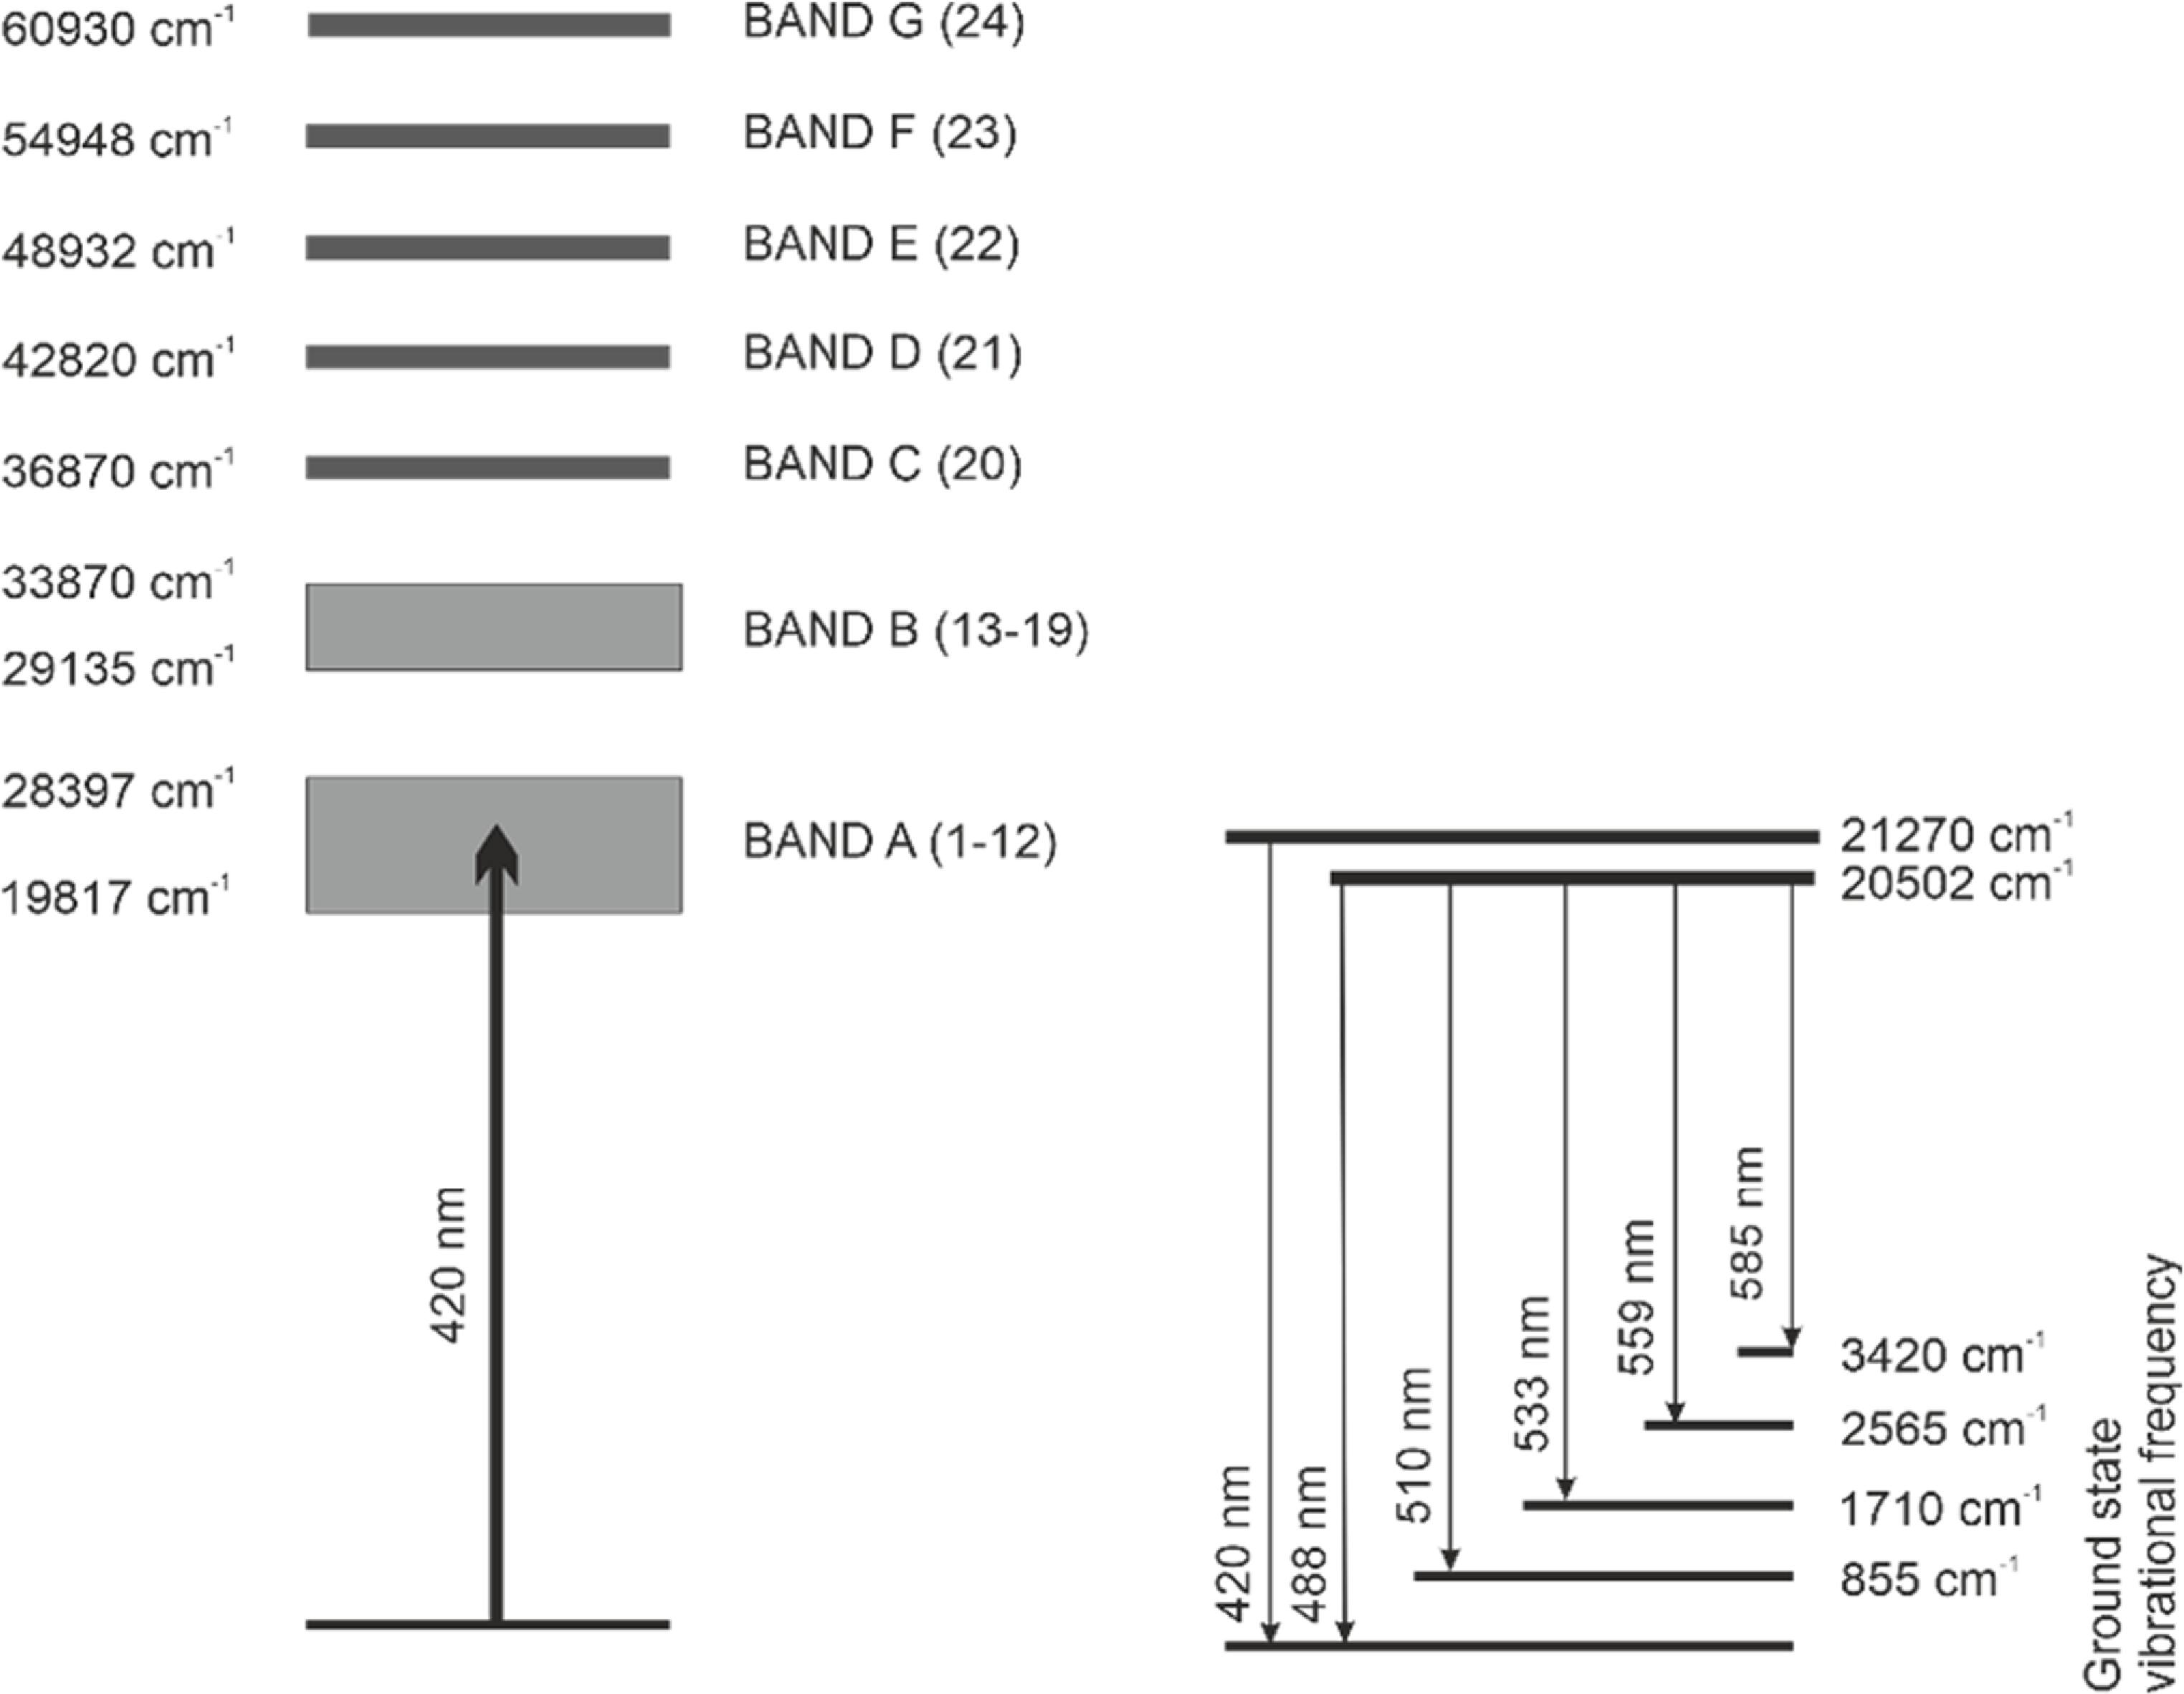
Bell and Biggers (1968) established the energy-level diagram for the UO22+, decomposing its absorption domain into 24 Gaussian-profile bands grouped into seven categories A to G (figure 1) [30]. Excitation at 420 nm—optimal for UO22+—promotes electrons to the A-group levels, which rapidly relax to two luminescent states emitting at 470.5 nm and 487.8 nm. The resulting emission spectrum exhibits a well-defined vibrational structure.
Download figure:
Standard image High-resolution imageHowever, the uranyl ion does not behave as an isolated entity. Its luminescence quantum yield and LL are sensitive to the surrounding medium. Variations in emission spectra arise from changes in the first coordination sphere (ligands directly bound to the central ion) [21, 32, 33], reflecting inner-sphere complexation processes. For instance:
- The number of water molecules present in the coordination sphere inversely correlates with LL due to quenching effects [34, 35],
- H2O ligand displacement by other molecules (e.g. hydroxyl anions or carbonates) typically extend the LL [23, 36, 37], and
- additional factors influencing LL may include temperature, solvent composition, and the presence of ligands or quenching agents etc [31, 38–41].
2.1.2. The principles of TRLFS
TRLFS involves selective excitation of a target species using pulsed laser light. Upon absorption, the species transitions to a higher energy state, followed by radiative relaxation emitting characteristic luminescence. Output data are represented as a 3D plot (intensity versus wavelength versus time), enabling species discrimination.
The sensitivity of LL to chemical environment makes TRLFS a powerful tool for probing metal-ion speciation in solution, widely applied in complexation studies [25, 42, 43]. Moreover, TRLFS permits quantitative analysis of species concentrations [44].
2.1.2.1. Application to uranium hydroxide systems
This study investigates luminescence properties of uranium(VI) hydroxide species across varying pH. High-sensitivity instrumentation, coupled with spectral deconvolution algorithms, enables the resolution of overlapping spectra into contributions from individual species.
The deconvolution and fitting precedure comprises several phases. Data were analyzed using a combination of singular value decomposition (SVD), the Factor Analysis of Time Series (FATS) approach, and Parallel Factor Analysis (PARAFAC) [45–47]. This multi-step strategy was chosen to obtain both robust estimates of the number of independent luminescnet species and a physically meaningful decomposition of their spectral and temporal signatures.
In the first stage, SVD was applied to the experimental data matrices, where rows represented the spectra recorded at successive time delays after the excitation pulse and columns corresponded to emission wavelengths. The singular values provided a direct criterion for the effective rank of the system, i.e., the minimum number of spectrally distinct luminescnet components required to describe the dataset without overfitting noise. The associated temporal loadings obtained from SVD were subsequently analyzed within the framework of FATS, which involves fitting each profile with a monoexponential decay function. In this way, preliminary fluorescence lifetimes and approximate spectral shapes of the individual species were obtained.
While this local analysis provides valuable first-order insight, it remains limited to individual spectral series. Therefore, in a second stage, all TRLFS data acquired under different experimental conditions (e.g., pH variation) were organized into a three-dimensional data tensor (emission wavelength × time × experimental condition). This tensor was subjected to PARAFAC, a multilinear decomposition method that simultaneously extracts pure spectral, temporal, and condition-related profiles. By constraining the solution across all dimensions, PARAFAC yields unique and chemically consistent components that allow the separation of true luminescnet species from measurement noise or experimental artifacts.
Together, the combination of SVD/FATS and PARAFAC provides both local and global perspectives on the TRLFS dataset. The initial rank estimation and monoexponential lifetime analysis ensure that the correct number of components is chosen, while PARAFAC delivers validated pure spectra and lifetimes that can be directly associated with distinct uranium species under the investigated conditions [16, 17].
Voigt profiles - a fitting method that accounts for the non-ideal shapes of fluorescent peaks resulting from both Gaussian and Lorentzian broadening effects - were used to characterize the spectral features of the individual pure specie.
2.1.2.2. Quantitative limitations and enhancements
While uranium concentration can be determined via luminescence, signal intensity is often suppressed by matrix effects (e.g., quenching by coexisting ions). Strategies to mitigate this include introducing luminescence-enhancing ligands (e.g., phosphate or carbonate) to boost signal intensity and LL, and calibrating measurements against known matrix effects (see [25] and [29, 35]).
2.2. Experimental
2.2.1. Uranium speciation modelling in alkaline environment and experimental observations
To model the expected uranium species distribution under the experimental conditions, a preliminary speciation study is performed. The following input values is used to construct graphs of the relative dependence of the species on pH: the total equilibrium uranium concentration [UTOTAL] of 10–4 M, pH is set in a range of 4.0 to 13.0 in an aqueous environment. The pH is regulated by NaOH. Uranium speciation diagrams are constructed under two conditions: (i) all solutions are CO2-free and (ii) solutions are in equilibrium with the atmospheric CO2. For the calculations Visual MINTEQ 4.05 software with database thermo.vdb, sources of constants: NEA 2003, THERMC9 and NIST 46.7 was used.
Due to the inherent instability of uranium solutions, precipitates formed in these solutions over time. Although present in minimal quantities, these precipitates were isolated for X-ray diffraction (XRD) analysis. Each precipitate sample was dispersed in 96% ethanol (analytical grade, Penta Chemicals, Czech Republic) and gradually deposited onto a clean XRD slide. XRD analysis was performed using a Miniflex600 diffractometer (Rigaku, Tokyo, Japan) operating at 40 kV and 15 mA. Data were collected over a 2θ range of 10° to 80° at a scan speed of 4°·min−1.
2.2.2. Experimental setup and chemicals
The TRLFS system shown in figure 2 consists of three main components: a laser unit, a sample compartment, and a detection part. The laser is a tuneable optical parametric oscillator (NT342C, Ekspla JSC, Lithuania) that emits wavelengths from 210 nm (UV) to 2,600 nm (near-infrared) at a 10 Hz repetition rate, with pulse lengths of 4–7 ns depending on the wavelength. Output energy, regulated by two Glan polarizers, ranges from 0.1% to ~80% for 350–2000 nm. The excitation wavelength is set to 420 nm with a pulse energy of 6.5 mJ and is focused into the sample using lenses (beam waist diameter was 2 mm). Laser energy fluctuations are kept below 6%, monitored per shot with a power meter, and each spectrum is normalized to the laser energy. An external fiber spectrometer (BLACK-Comet, StellarNet, Inc., FL, USA) controls the output wavelength.
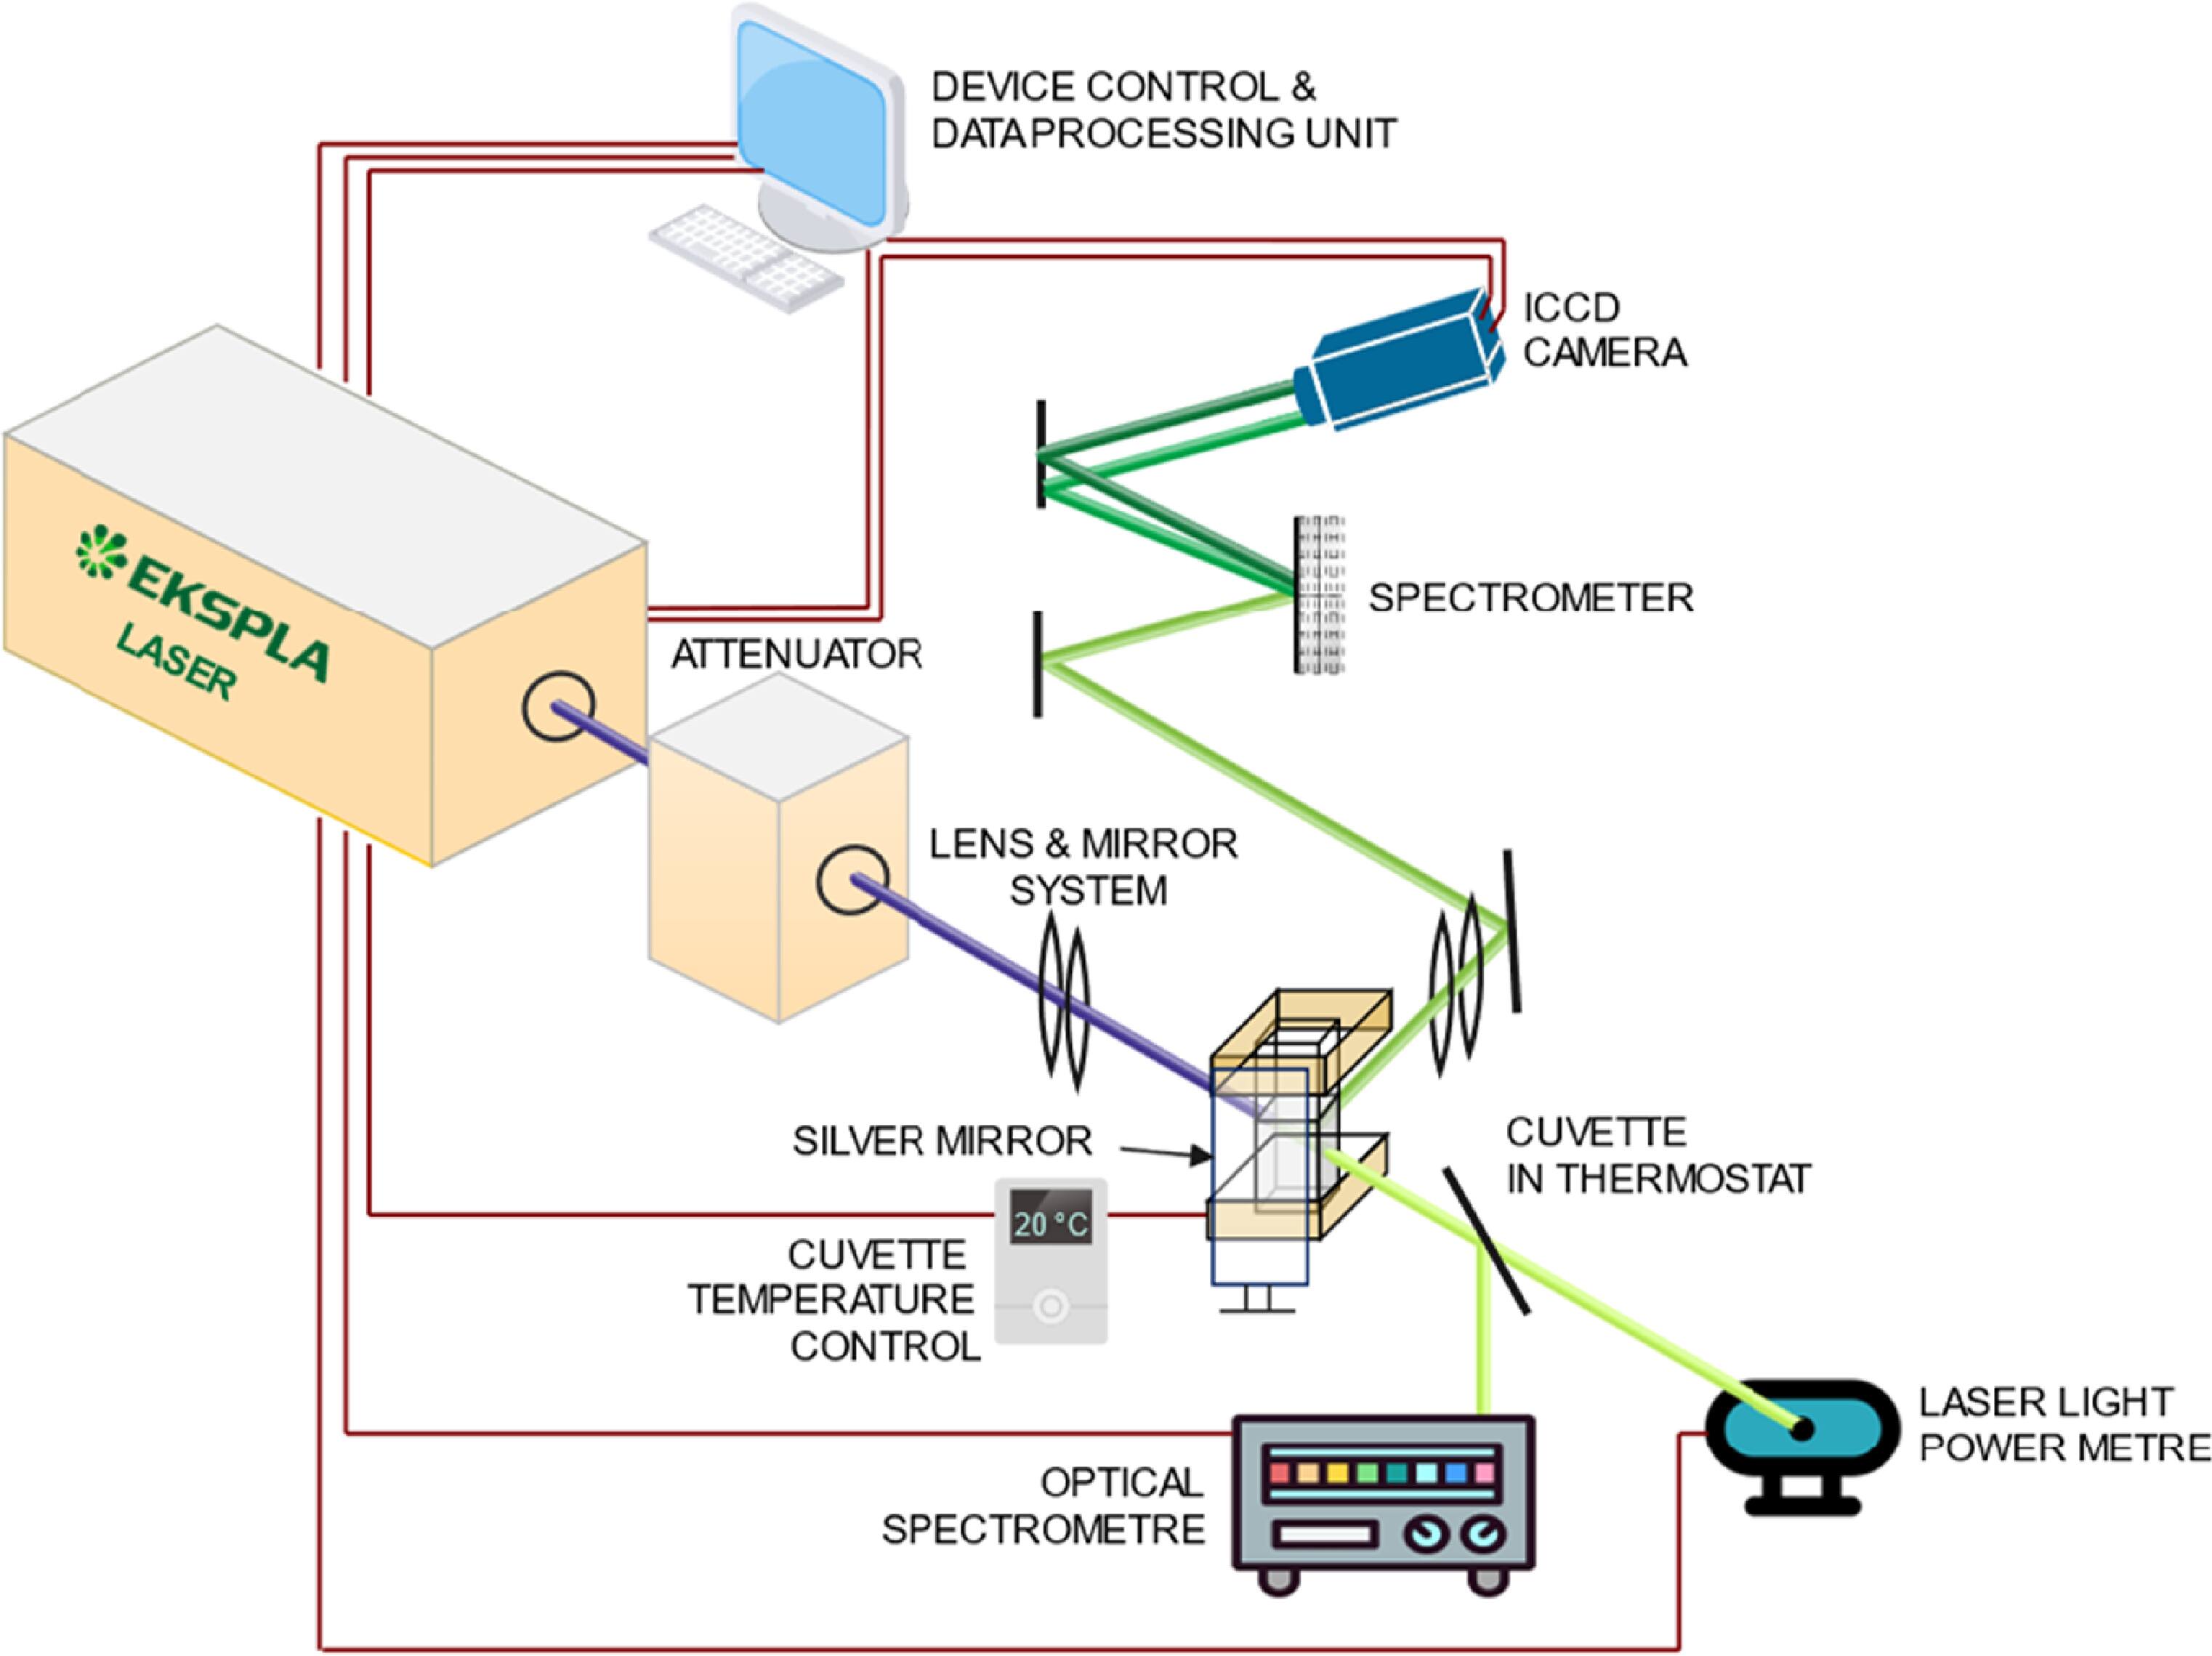
Figure 2. Simplified diagram of TRLFS system.
Download figure:
Standard image High-resolution imageEmitted luminescence radiation is collected perpendicularly to the excitation beam and focused into the entrance slit of a monochromator (MS257 LOT-Oriel®, 600 grooves/mm, 280–1200 nm) for dispersion, which is then intensified and detected by an ICCD camera (iStar DH720i-18F-03, Oxford Instruments Andor Ltd, UK). The luminescence intensity represents the photon flux at the corresponding wavelength emitted by the excited sample per unit time, which is collected and quantified by the detector. Time resolution is controlled by gate delays, with optimized acquisition parameters for two time domains: the first uses a gate delay of 100 ns and a width of 50–100 ns, while the second spans from 50 ns to 1,000 ns, based on uranium(VI) complex characteristics. Sample temperature, critical for luminescence intensity [48], is controlled to 20 ± 0.2 °C using a cuvette holder with a temperature controller (Flash 200 + TC 101, Quantum Northwest, Inc., Liberty Lake, WA, USA). Luminescence spectra were recorded in the range of 450–700 nm.
The following chemicals were used in the experiments. UO2(NO3)2·6 H2O (≥98%, Fluka Chemistry, Germany), NaOH (≥98%; carbonates content ≤0,4%, Carl Roth GmBH + Co. KG, Karlsruhe, Germany), HNO3 (68%, p.a., P-LAB, Czech Republic), pH calibration buffers—pH = 4.005, 7.000 and 10.012 (Radiometer Analytical, Denmark).
2.2.2.1. Samples preparation
Uranium solutions were prepared by dissolving UO2(NO3)2·6 H2O in deionized water (18 MΩ·cm−2, Direct-Q®, Merck Millipore, Burlington, MA, USA) to achieve a final analytical concentration of 0.4 M uranium. This concentration was selected based on a comprehensive evaluation of speciation diagrams. The pH was adjusted from 4.3 to 10 using a NaOH solution. Deionized water was used for all solution preparations. pH measurements were performed using a tabletop pH meter (Mettler Toledo FiveEasy Plus, with LE438 probe, Switzerland). To minimize the impact of carbonates generated during the preparation of dilute NaOH solutions, a saturated NaOH solution was first prepared. This saturated solution does not readily absorb atmospheric CO2, which helps reduce carbonate formation. From this saturated solution, we then prepared a fresh diluted NaOH solution for pH adjustment.
Standard fluorometric cells (10 mm optical path) are pre-cleaned by rinsing with deionized water and then placed in a bath of 3% HNO3, and re-rinsed with deionized water. Immediately prior to measurement, cells are rinsed with the sample solution. To mitigate uranium sorption on cell walls (which may influence luminescence data in neutral/alkaline media) and carbonate contamination, measurements are conducted in closed cuvettes immediately after sample preparation. This approach enables detection of transient uranium(VI) species in alkaline environments.
Prolonged air exposure of samples in cuvettes promotes atmospheric CO2 absorption, leading to the formation of UO2(CO3)22– (appearing at pH ≥ 8), and UO2(CO3)34– (dominant at pH > 9) [49]. These carbonato species exhibit no measurable luminescence at 20 °C–27 °C [50]; thus, their formation precludes detectable signal. Fresh solutions are prepared for each pH increment (ΔpH = 0.2–0.5) across the studied range (pH 4.3–13.0). All solutions are analysed via TRLFS, followed by mathematical data processing.
2.2.3. Quantification of uranium concentration
To quantify precipitate formation, the residual uranium concentration in the solution was determined. Prior to analysis, each sample was acidified with HNO3 to achieve a final concentration of 1 M, ensuring (i) complete conversion of uranium species to the uranyl ion (UO22+); (ii) and maintaining analytical robustness, particularly under such a highly alkaline condition. Subsequently, H3PO4 was added at an optimized volumetric ratio of 2.5: 8 (1 M H3PO4: acidified sample) to promote UO22+ complexation.
Spectroscopic measurements: To minimize the influence of potential fluctuations in laser energy on the measured luminescence intensities, the pulse energy was monitored using a power meter, and each recorded spectrum was normalized to the corresponding laser output energy. Laser pulse energy was maintained at (4.0 ± 0.2) mJ (measured post-sample cell) for all measurements. Each measurement represents an accumulation of 200 spectra.
pH dependence study: The effect of pH (range: 5–11) on the luminescence intensity was systematically studied in the pH range of 5 to 11, at uranium concentrations between 0.1 and 1.1 × 10⁻⁴ M. The pH was adjusted exclusively by incremental addition of NaOH to avoid introducing additional variables. Each data point represents the mean value derived from five independently prepared samples; each measured in duplicate. All values were set to be identical within one series, making the pH measurement error dependent solely on the instrument resolution, reported by the manufacturer as ±0.01.
3. Results
3.1. Alignment of uranium speciation modelling with experimental results
Theoretical speciation refers to the predictions made through mathematical modelling concerning the UO22+/CO32–/H2O and UO22+/H2O system. This modelling presents various speciation diagrams that illustrate the behaviour of uranium (VI) ions in solution at different concentrations. The theoretical results suggest how uranium interacts with carbonate ions and water under various conditions. The outcomes derived from the mathematical modelling are depicted in the speciation diagrams shown in figure 3.
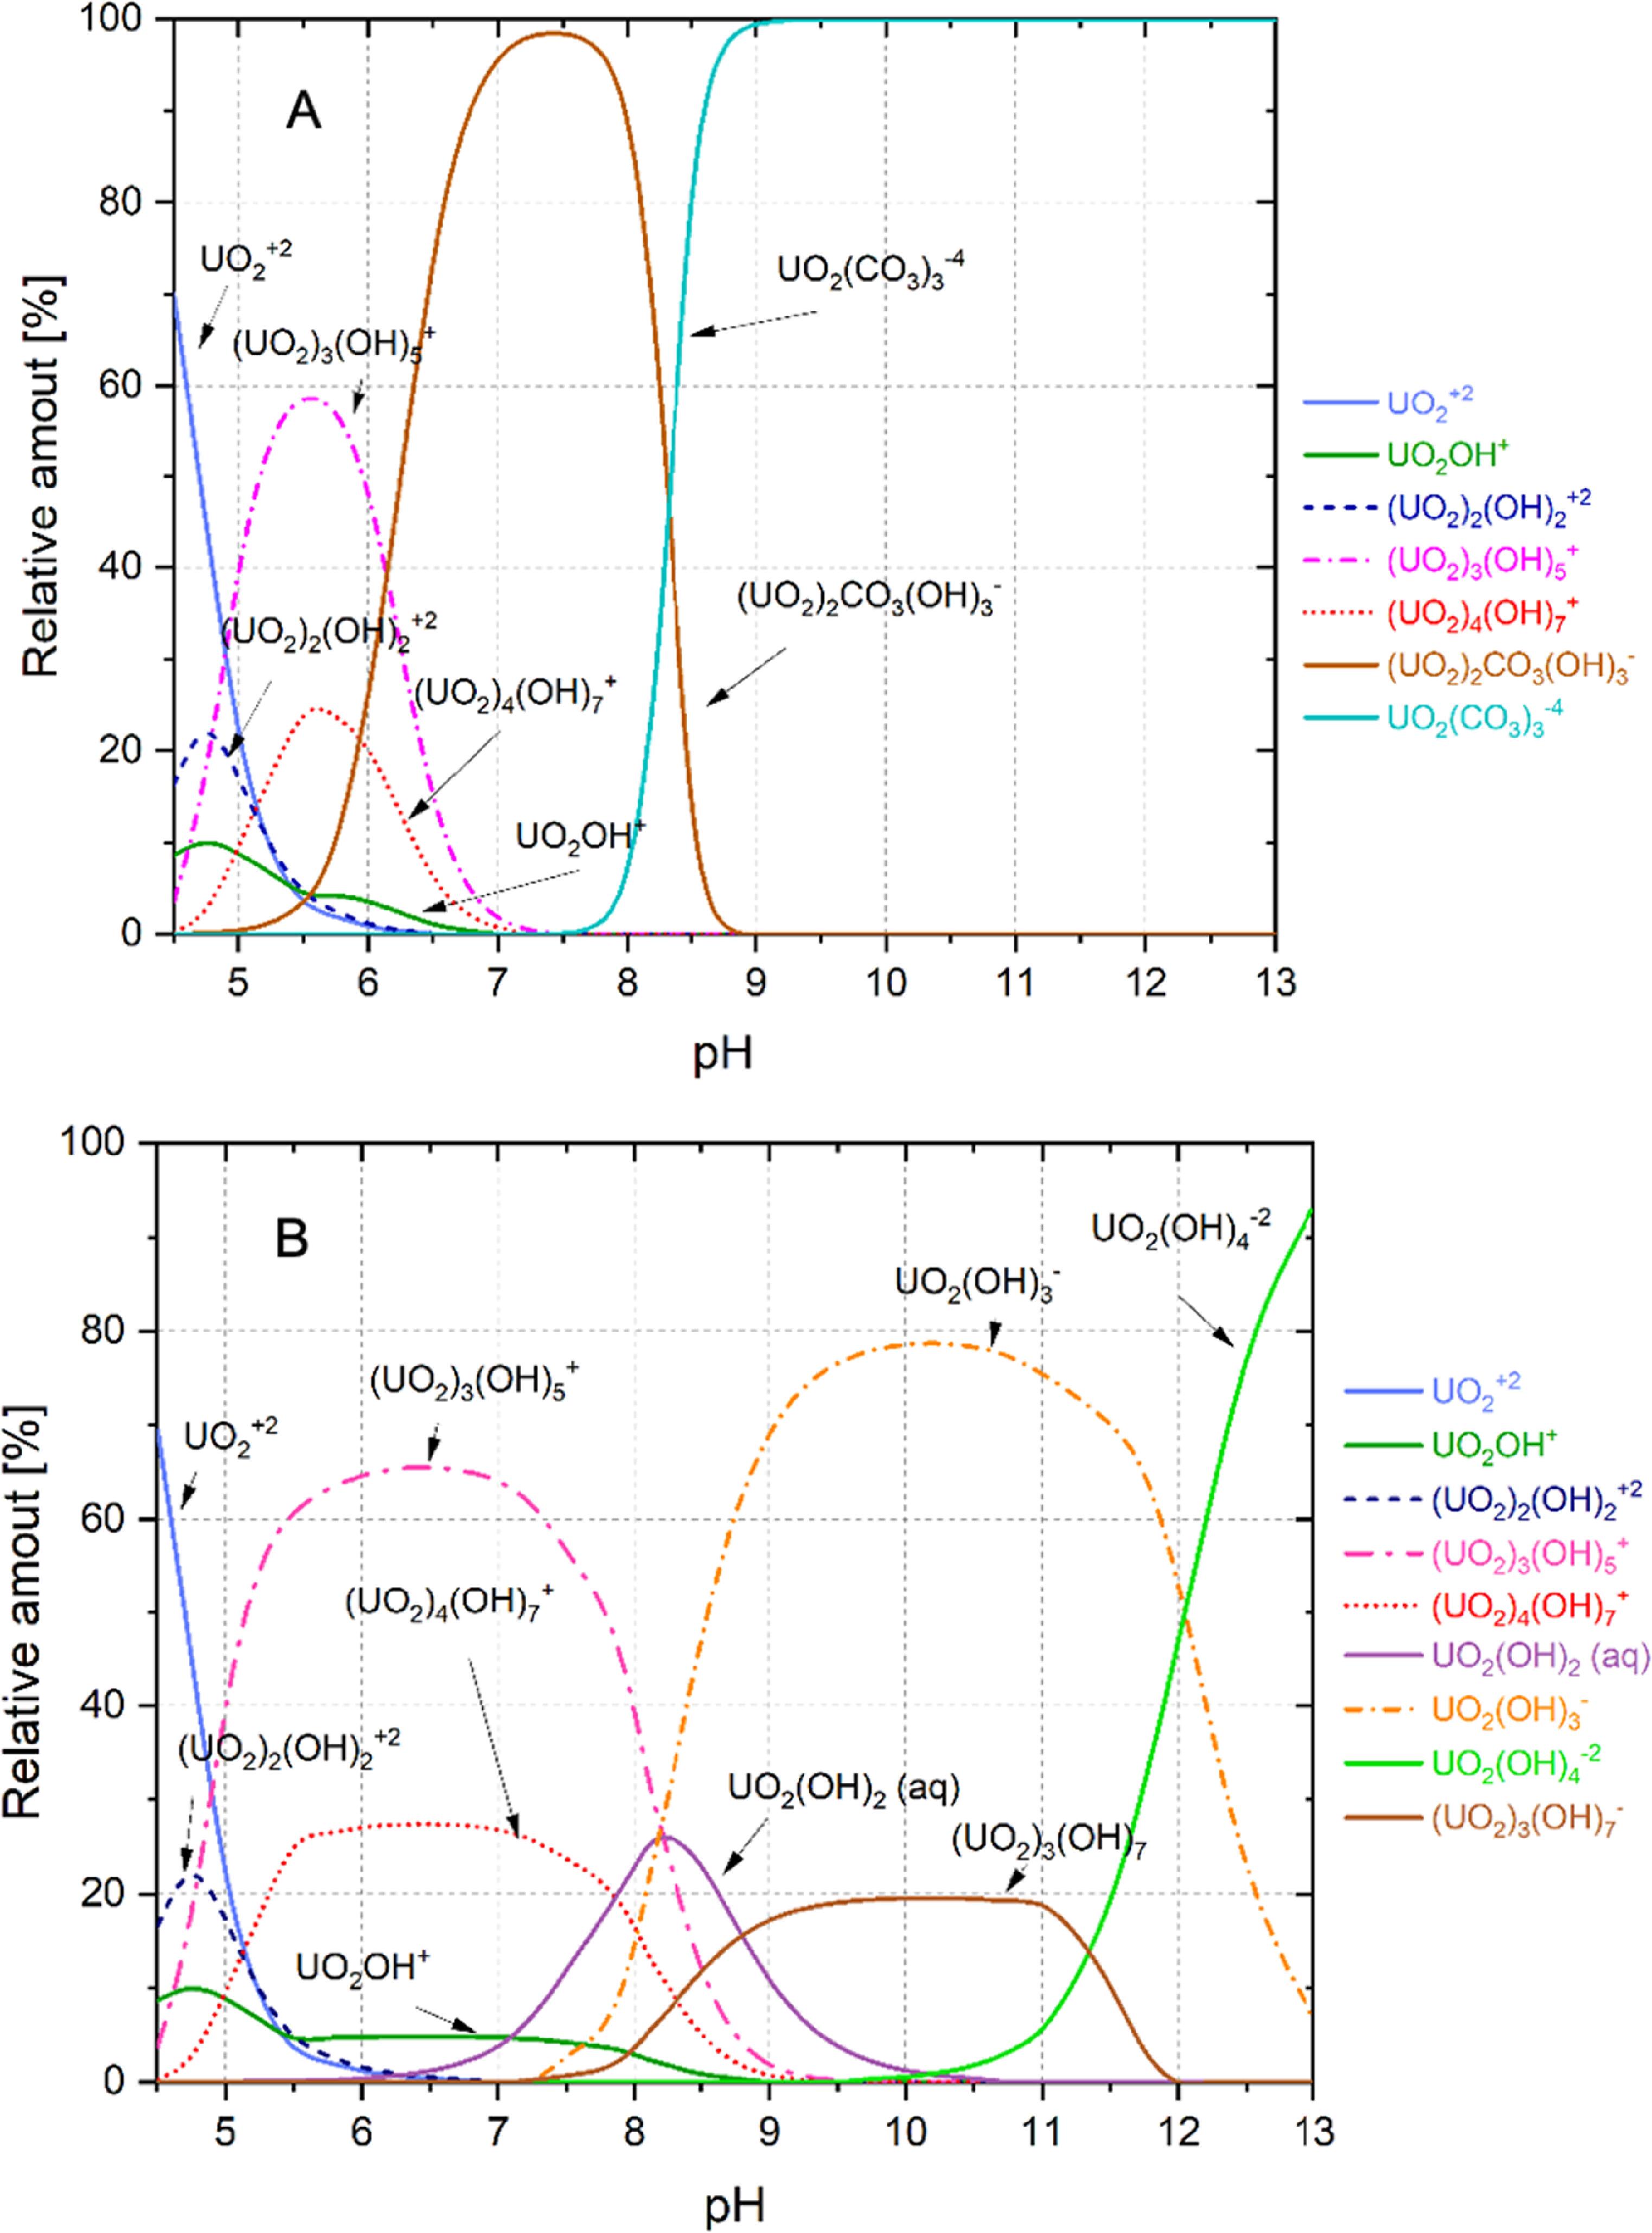
Figure 3. Speciation diagrams of the relative aqueous species for uranium (VI) at a total concentration of [UTOTAL] = 10–4 M: (A) in equilibrium with atmospheric CO2; (B) under inert conditions.
Download figure:
Standard image High-resolution imageLaboratory experiments conducted under controlled conditions revealed the formation of a minor precipitate within several days in samples with pH values ranging from 6 to approx. 11. The nature of these precipitates was characterized using XRD (figure 4); detailed kinetic study of precipitate formation can be found in figure 12. Results for the pH range 6.0 to 10.8 are presented in figure 3. As shown, the diffractograms for solutions within pH 6.0–9.6 are nearly identical. The peak positions indicate that the precipitate in this pH range is most likely schoepite, (UO2)8O2(OH)12·12 H2O. The broad feature, often termed an ‘amorphous hump’, centred around 25°–30° 2θ corresponds to the glass slide support; this prominence is attributed to the thin layer of precipitate obtained. In contrast, the diffractogram for the solution at pH 10.8 is markedly different. Two additional low-angle peaks are evident, although these could not be definitively identified. Based on the peak positions, the phase is tentatively proposed to be a layered sodium uranate mineral, potentially Na-compreignacite (Na2(UO2)6O4(OH)6(H2O)7), where Na+ ions are exchangeable [51, 52]. The XRD-identified phases correspond well with the predicted solid phases from speciation diagrams at respective pH values. The transition from schoepite to Na-compreignacite at higher pH is consistent with changes in uranium speciation and solubility. Furthermore, compreignacite formation may proceed from schoepite via a meta-schoepite intermediate stage. In light of this, we tentatively believe that this spectrum could be assigned to Na-compreignacite. The precipitates underwent solid-phase TRLFS measurements; however, none yielded a detectable spectrum.
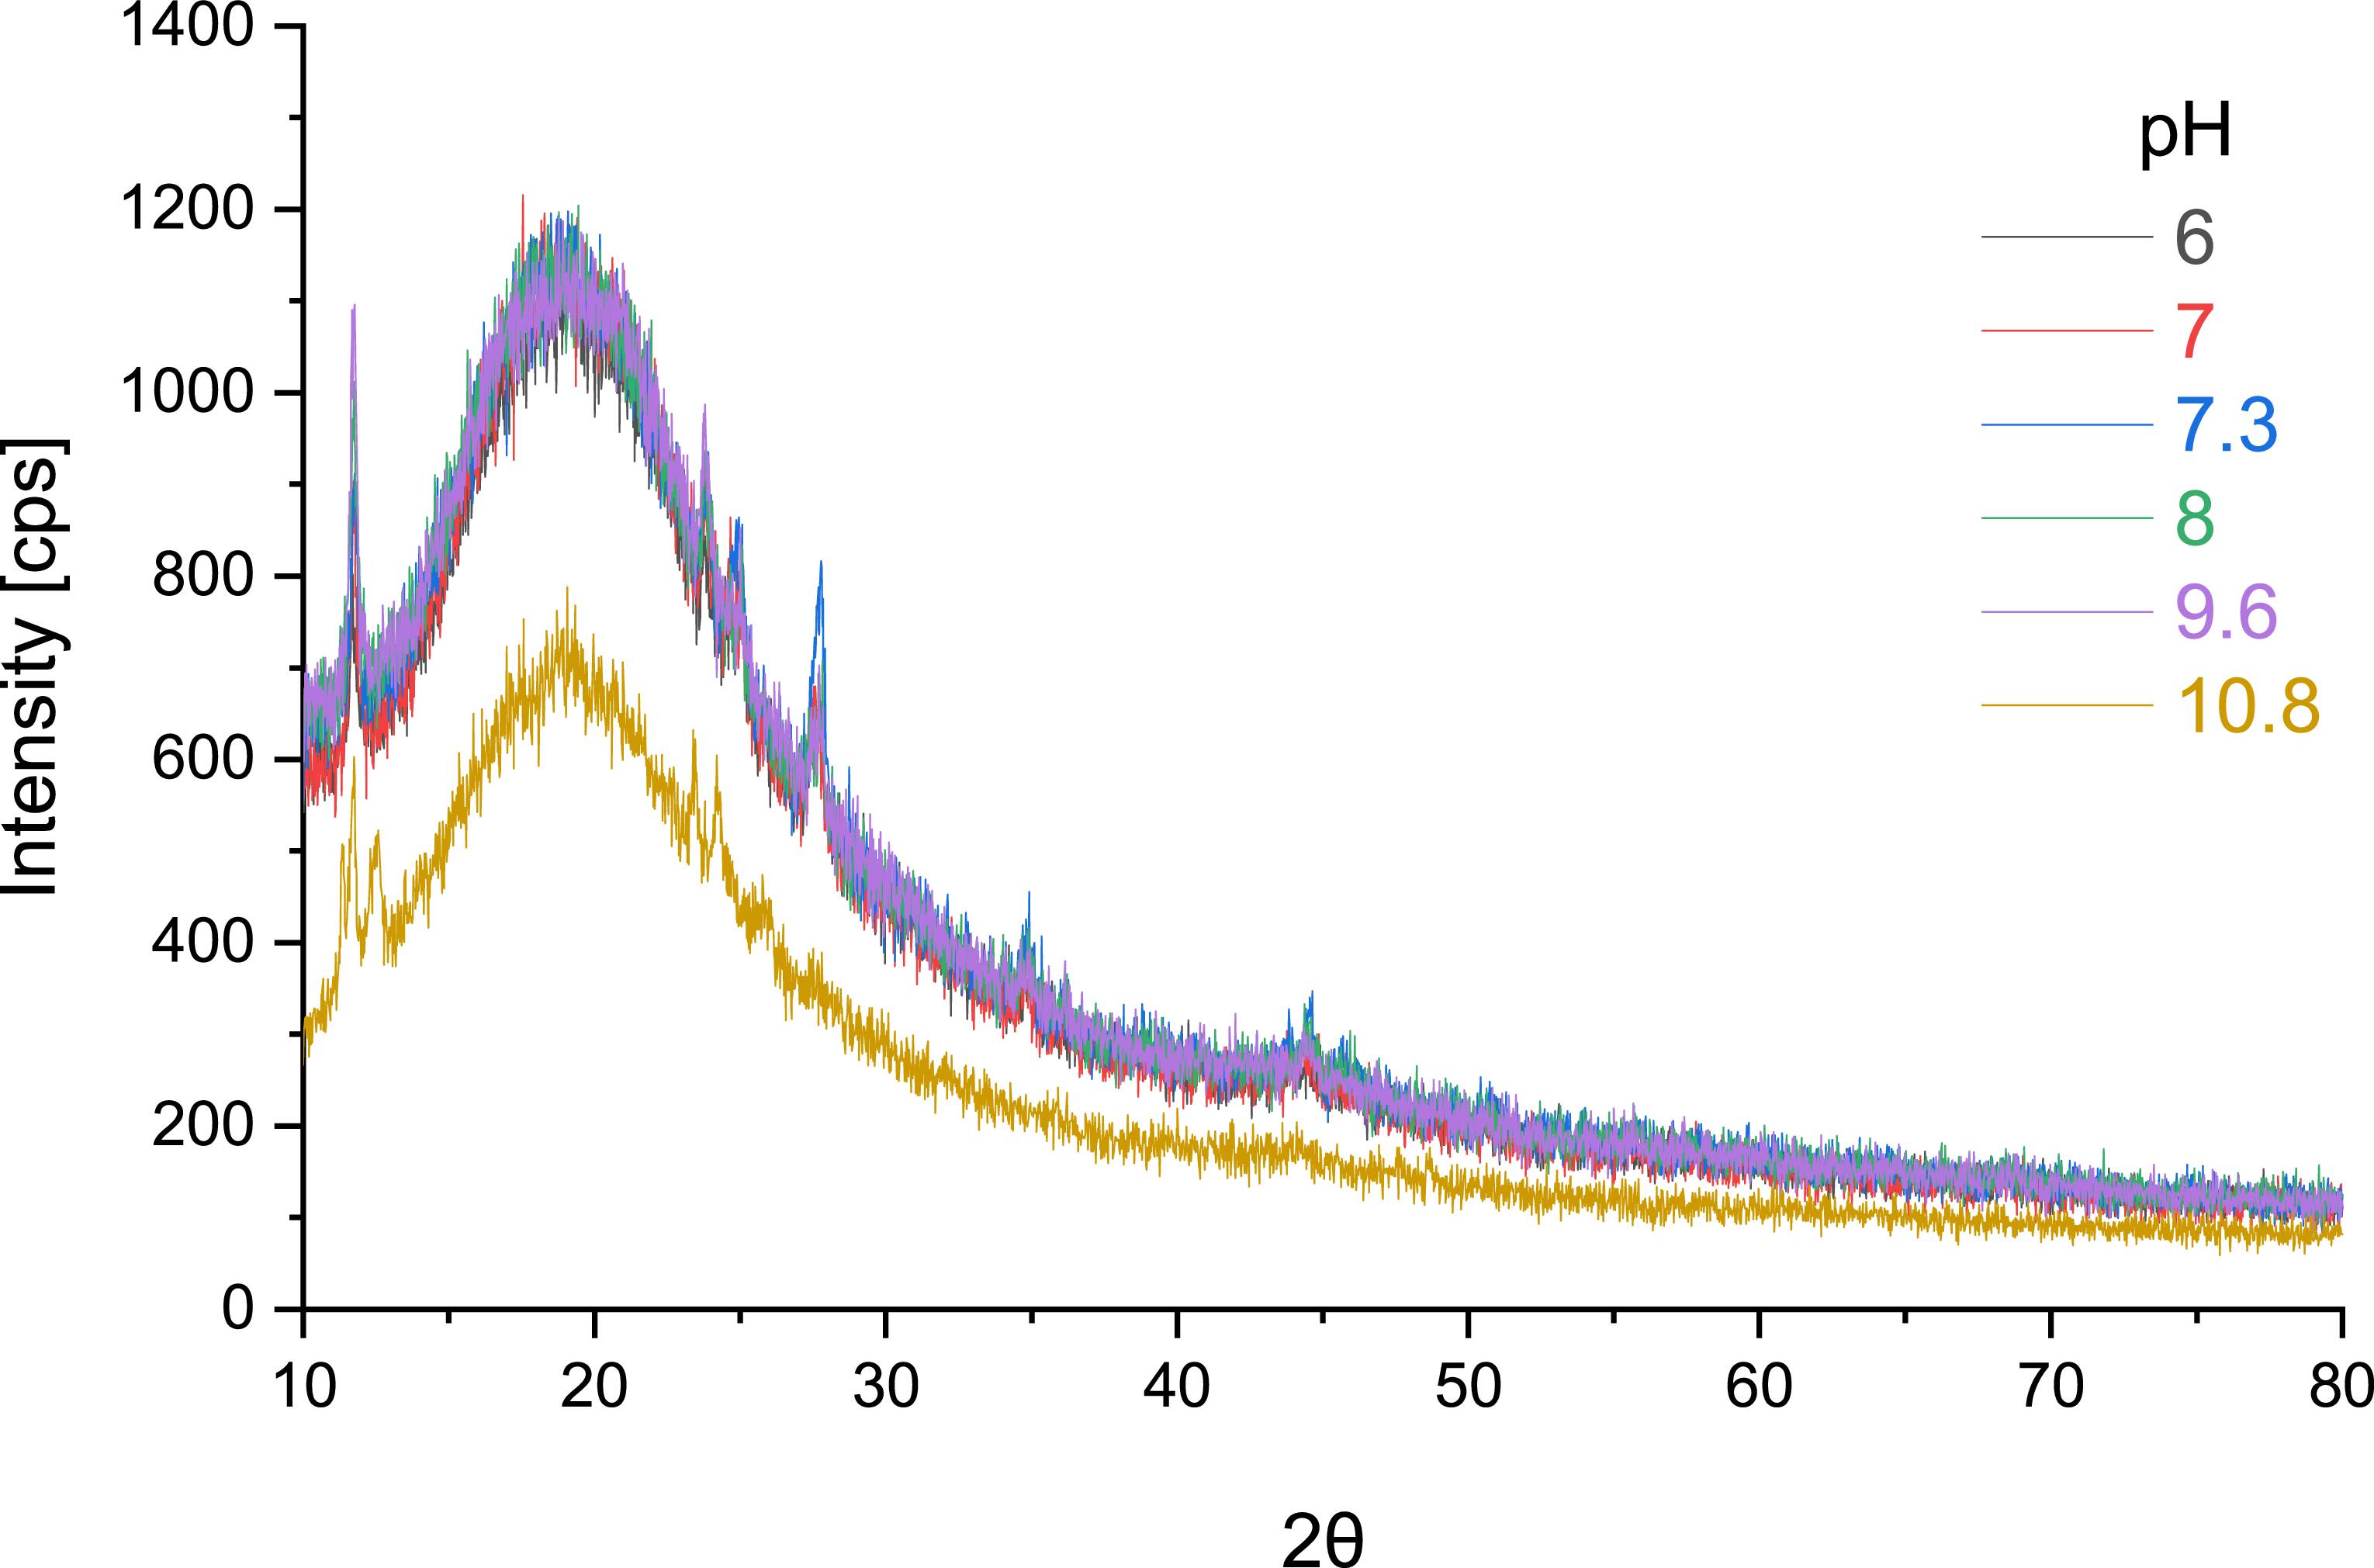
Figure 4. Diffractogram of precipitates derived from uranium solutions.
Download figure:
Standard image High-resolution image3.2. TRLFS measurement
To enable more accurate identification of the species formed, preliminary measurements were carried out under an inert atmosphere to prevent interaction with atmospheric CO2. This approach ensured that only species formed in the absence of carbonate interference were detected. Subsequently, analogous measurements were performed under ambient air conditions to evaluate the influence of CO2 uptake on species formation and stability.
The spectral characteristics of identified uranium species are shown in figure 5. The deconvolution of the cumulative spectra was carried out or using in-house MATLAB (The MathWorks, Inc., Natick, MA, USA) procedure in this analysis, a factor analysis approach and deconvolution with Voigt profiles were applied.
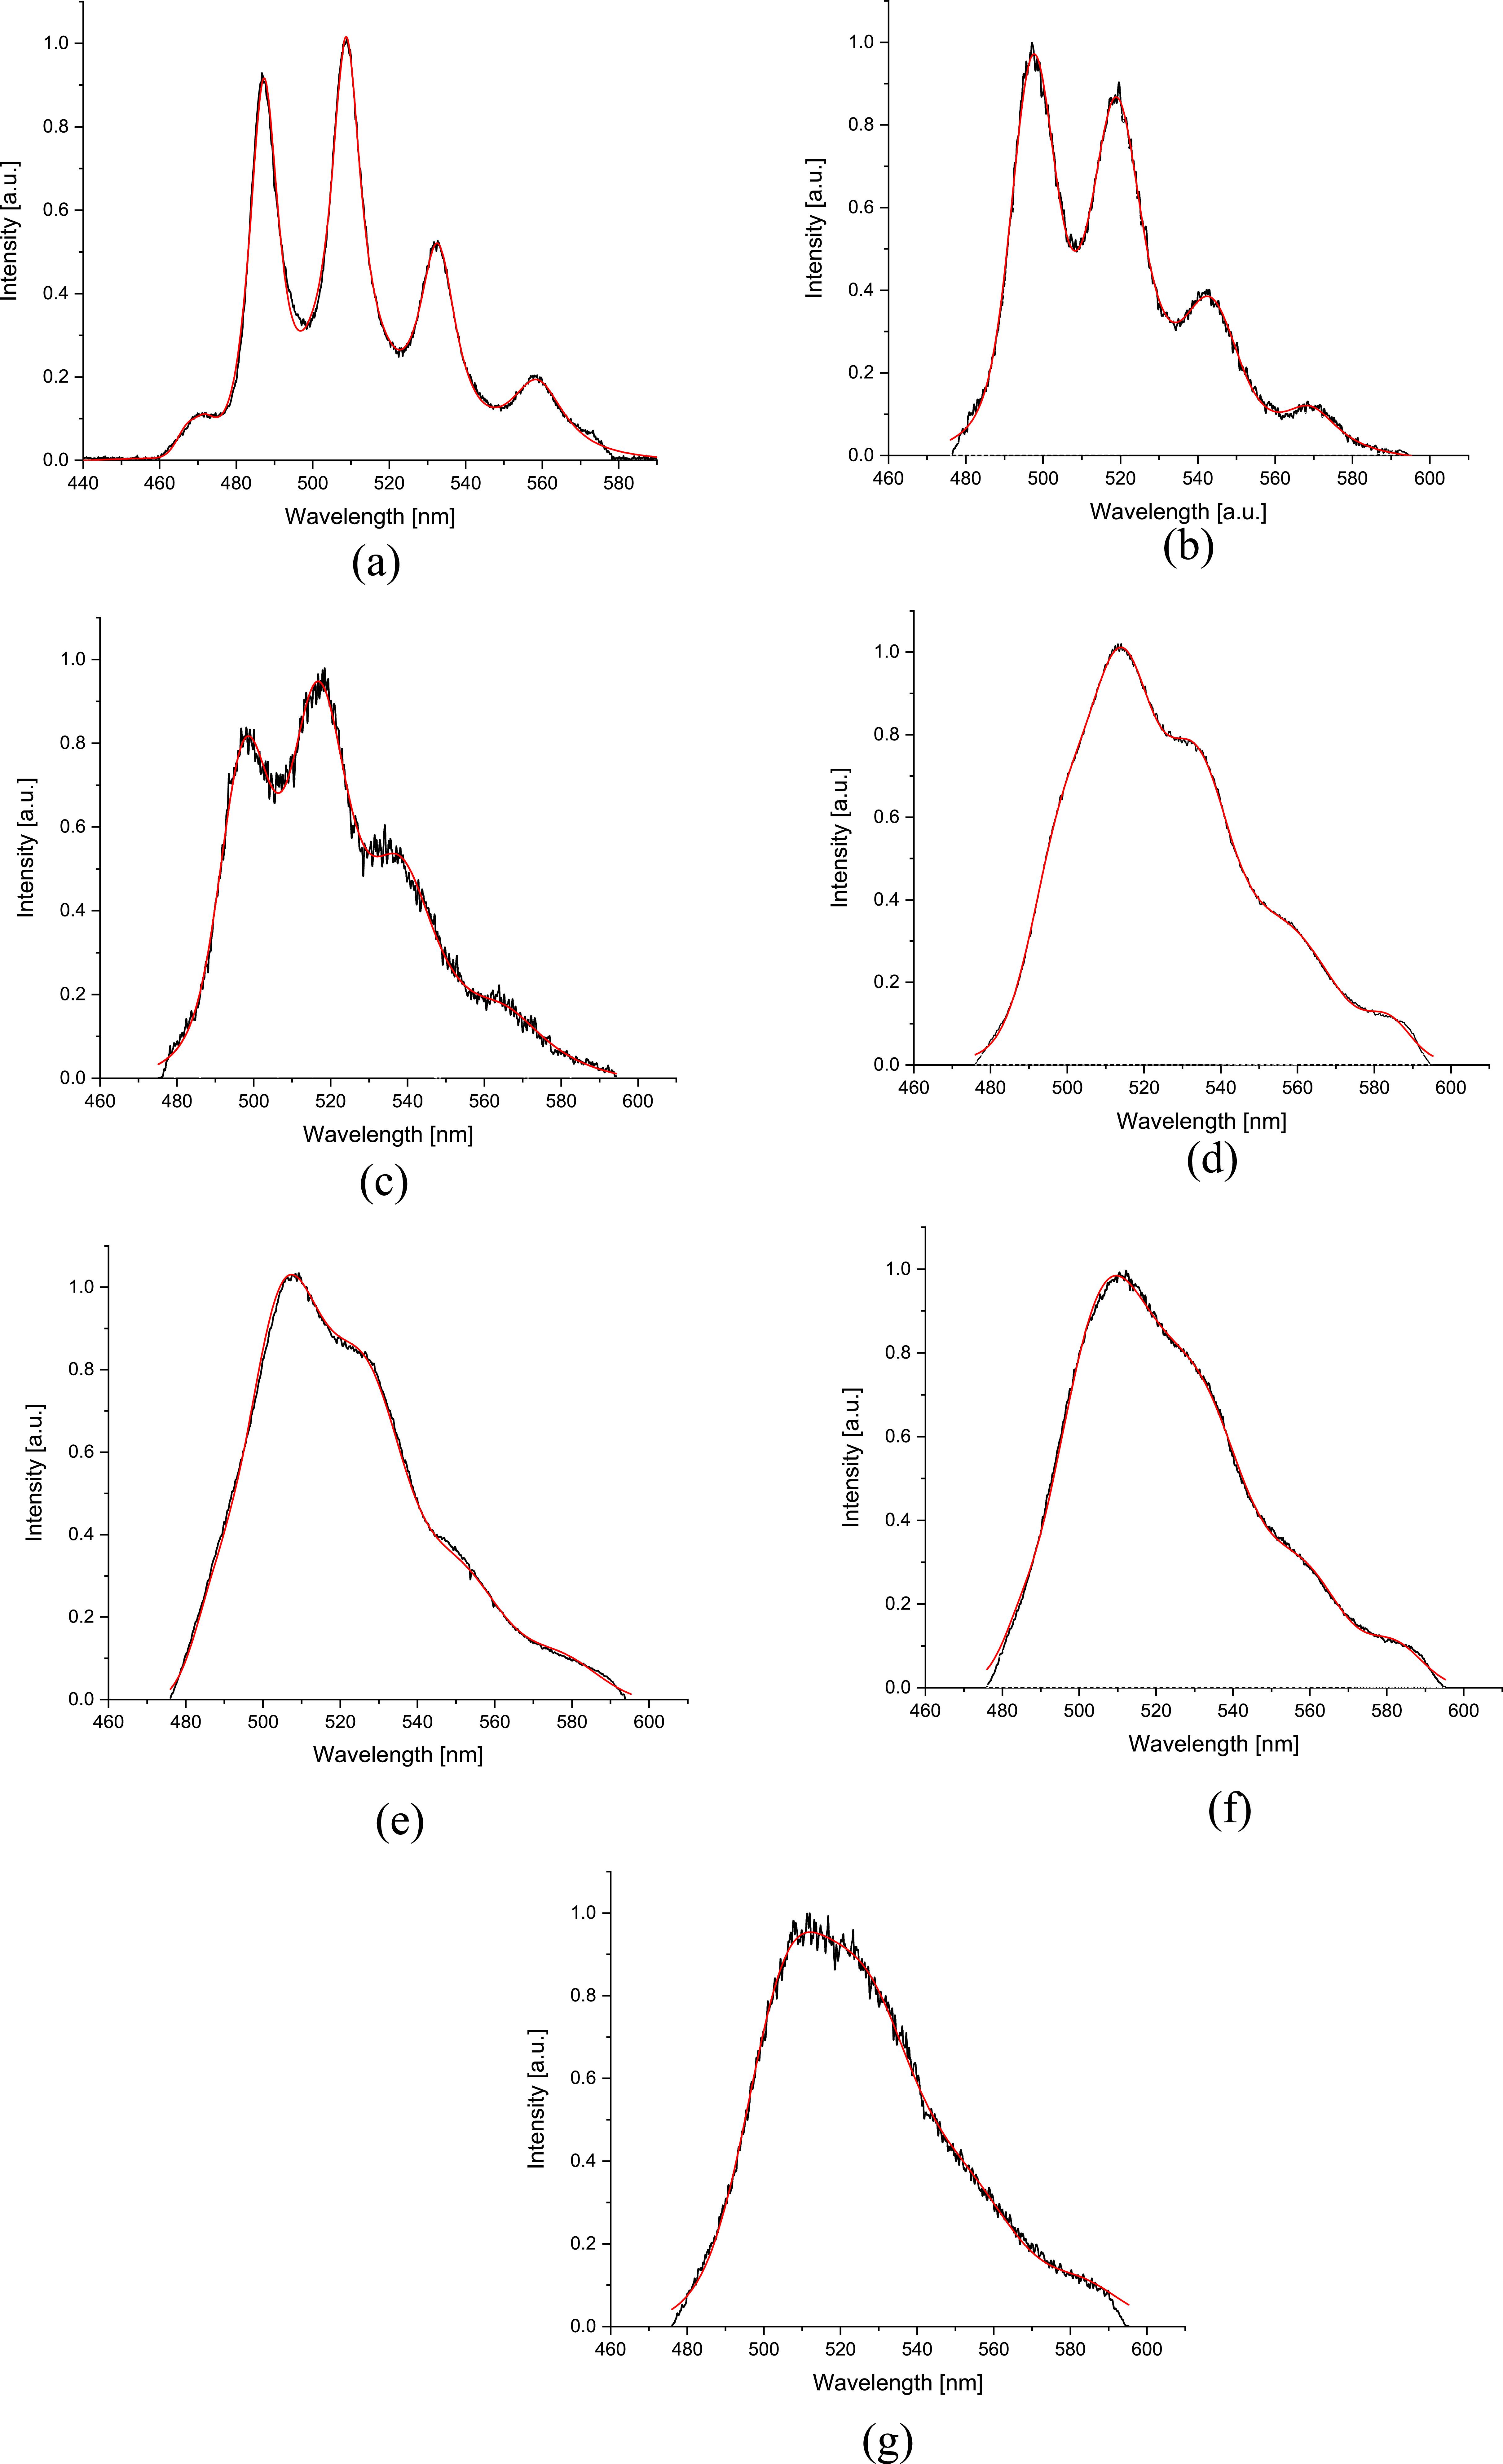
Figure 5. (A). UO22+, spectral characteristics of identified uranium species deconvoluted with Voigt curves. (B). [UO2OH]+, spectral characteristics of identified uranium species deconvoluted with Voigt curves. (C). [(UO2)2(OH)2]2+, Spectral characteristics of identified uranium species deconvoluted with Voigt curves. (D). [(UO2)3(OH)5]+, spectral characteristics of identified uranium species deconvoluted with Voigt curves. (E). [(UO2)3(OH)7]−, Spectral characteristics of identified uranium species deconvoluted with Voigt curves. (F). [(UO2)2CO3(OH)3]−, spectral characteristics of identified uranium species deconvoluted with Voigt curves. (G). [(UO2)4(OH)7]+, spectral characteristics of proposed uranium species deconvoluted with Voigt curves.
Download figure:
Standard image High-resolution imageAn overview of the local maxima wavelengths is provided in table 1, while table 2 summarizes the measured luminescence lifetimes (LL) and comparison with published data. As shown above, the results exhibit good agreement with the literature, for example, in [21, 35, 53–55].
Table 1. Determination of spectral characteristic wavelength maxima of species obtained through deconvolution.
| Species | Maxima position (nm) | ||||
|---|---|---|---|---|---|
| UO22+ | 472.1 | 488.5 | 510.1 | 533.4 | 559.2 |
| [UO2OH]+ | 481.2 | 497.3 | 518.9 | 542.3 | 568.9 |
| [(UO2)2(OH)2]2+ | 482.5 | 497.6 | 517.1 | 539.2 | 565.6 |
| [(UO2)3(OH)5]+ | 498.6 | 514.8 | 532.9 | 556.5 | 584.1 |
| [(UO2)3(OH)7]– | 482.2 | 505.6 | 526.8 | 549.8 | 577.1 |
| [(UO2)2CO3(OH)3]– | 478.0 | 506.8 | 532.1 | 558.6 | 582.1 |
| [(UO2)4(OH)7]+ | 485.3 | 505.1 | 525.9 | 551.5 | 584.2 |
| [UO2(OH)3]– | 483.0 | 500.8 | 519.0 | 545.0 | 570.5 |
Table 2. Comparison of measured LL with published data.
| Species | LL measured (μs) | LL from literature (μs) |
|---|---|---|
| UO22+ | 1.9 ± 0.2 | 0.9 ± 0.2 [56], 1.7 ± 0.2 [22], [21], 1.9 ± 0.2 [22], [50], 2 ± 0.1 [57], 7.9 [21] |
| [UO2OH]+ | 12.8 ± 0.5 | 10.5 [53], 32.8 ± 2 [21], 80 [58], [59], 39.3 [54] |
| [(UO2)2(OH)2]2+ | 9.2 ± 0.3 | 1.9 ± 0.2 [23], 2.9 ± 0.4 [22], [56], 9.5 ± 0.3 [22] |
| [(UO2)3(OH)5]+ | 10.9 ± 0.6, 16.0 ± 0.7, 29.6 ± 0.6 | 6.6 ± 0.3 [21], 7 ± 1 [59], 23 ± 3 [57], 25.3 [54], 33.3 [60] |
| [(UO2)3(OH)7]– | 1.1 ± 0.1, 2.4 ± 0.3 | 1.1 ± 0.02 [22], 10 ± 2 [21] |
| [(UO2)2CO3(OH)3]– | 5.5 ± 0.7, 9.7 ± 0.9, 20.7 ± 0.7, 31.7 ± 0.6, 50.1 ± 1.1 | 35 ± 5 [21] |
| [(UO2)4(OH)7]+ | 1.6 ± 0.5 | — |
| [UO2(OH)3]– | 0.17 ± 0.05 | 0.15–0.2 ± 0.1 [61], 0.4 ± 0,1 [21], 0.8 ± 0.1 [57] |
It should be noted that the data presented in this paper are partially consistent with previously published results [21, 62]. The differences stem from variations in experimental conditions and experimental setup. The settings used in this work represent more optimized conditions, which limit the direct comparability of the luminescence decay times with those reported in previous studies. An explanation for the measurement of different lifetimes for the same species at the same temperature will be provided.
A description of the formation of uranium species in specific pH ranges will be provided, starting with the inert system and followed by measurements under ambient atmospheric conditions. This approach allows for a comparison of species formation behaviour in the absence and presence of atmospheric CO2.
Uranium(VI) speciation study in range of 4.3 < pH < 7
Measurements commenced at pH 4.3, corresponding to the original pH of the uranium solution without NaOH addition. Hydrolysis is already evident at this pH, with three species present: UO22+ (decay time of 1.9 ± 0.2 μs), [UO2OH]+ (decay time of 12.8 ± 0.5 μs), and [(UO2)2(OH)2]2+ (decay time of 9.2 ± 0.3 μs) as identified by preliminary speciation calculations and relative luminescence intensities. As pH increases, [(UO2)3(OH)5]+ and proposed [(UO2)4(OH)7]+ gradually formed, becoming significant by pH 6. At pH 6, [(UO2)3(OH)5]+ dominates in the solution. The time-resolved spectrum revealed a species with spectral characteristics identical to [(UO2)3(OH)5]+ exhibiting distinct decay times of 10.9 ± 0.6 μs, and 29.6 ± 0.6 μs. While speciation diagrams predicted no additional chemical forms, these differing lifetimes suggest potential alterations within the first hydration sphere. Consequently, we hypothesize a rearrangement of water molecules among different configurations of the same [(UO2)3(OH)5]+ complex. Representative spectral characteristics for solutions with pH = 4.3 and the deconvolution of the composite spectra into individual components assigned to each complex are shown in figure 6.
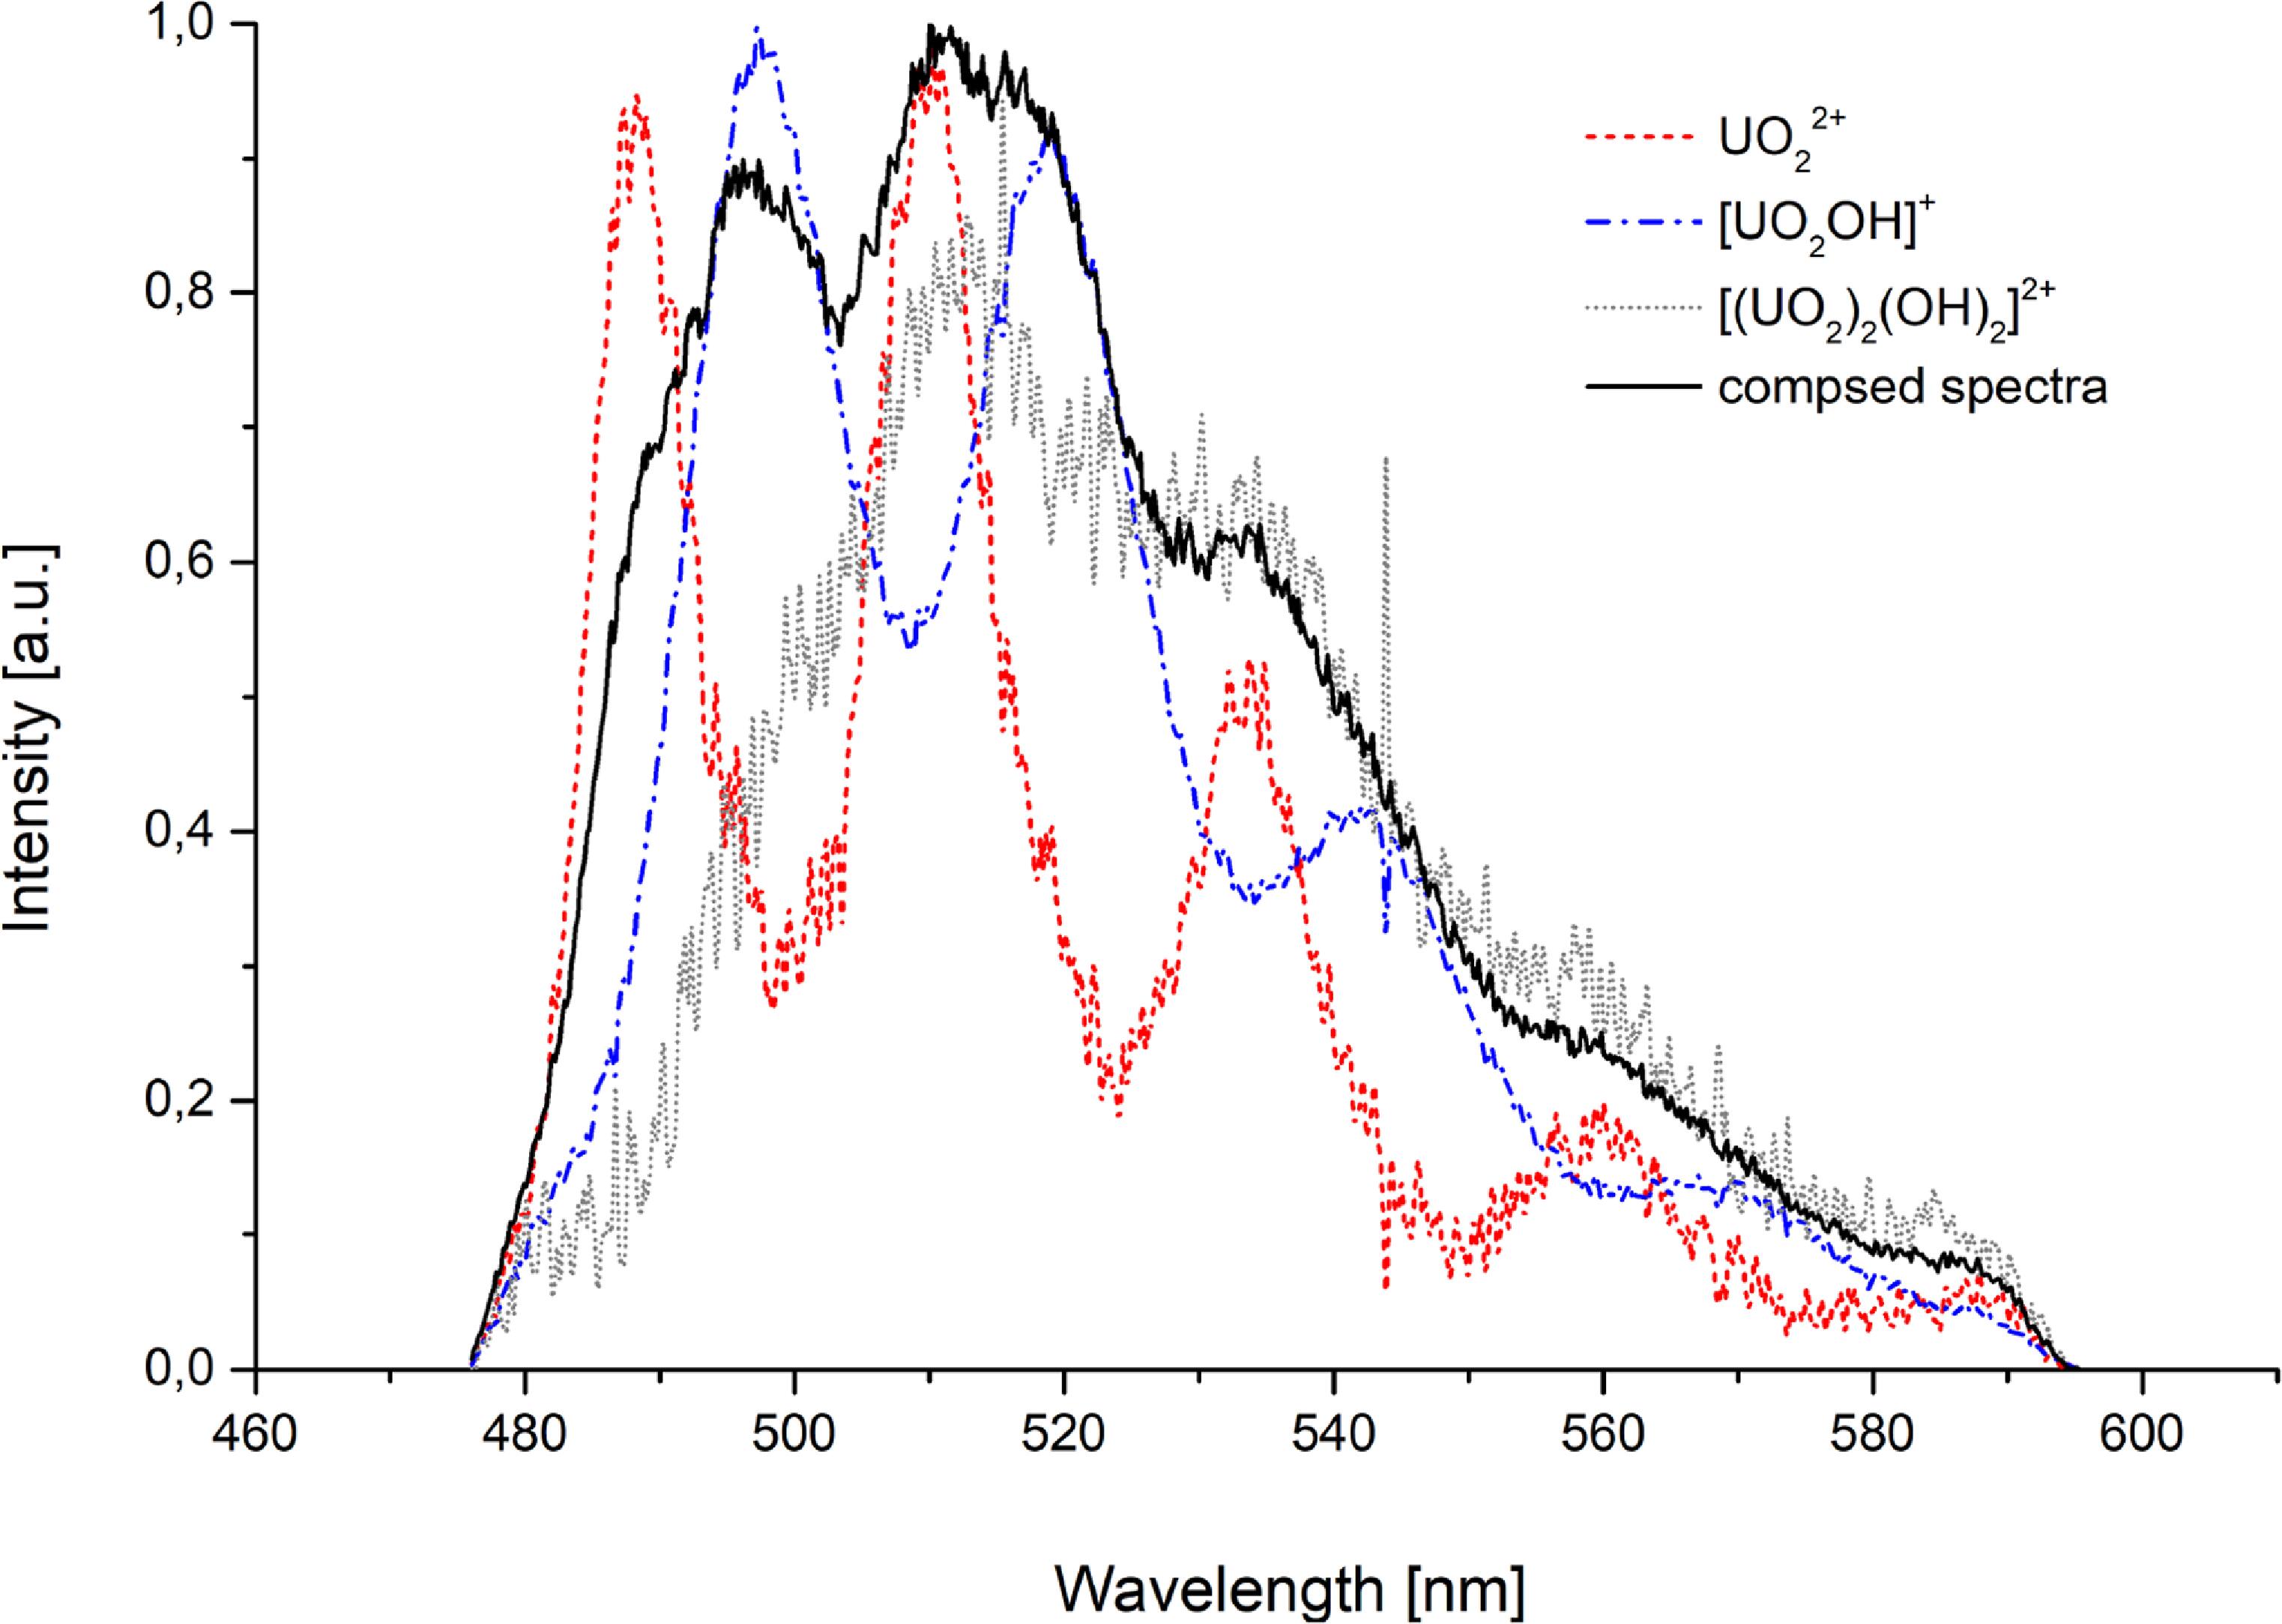
Figure 6. Spectral characteristic of the deconvolution of spectra assigned to individual forms, as well as the combined spectra for pH 4.3 solution.
Download figure:
Standard image High-resolution imageUranium(VI) speciation study in the range of 7 < pH < 8.5
Under inert conditions at pH > 7, two complexes emerged: [(UO2)4(OH)7]+ (decay time of 1.6 ± 0.5 μs), and [UO2(OH)3]−, as indicated by preliminary speciation calculations. We propose the existence of the [(UO2)4(OH)7]+ complex, which, to the best of our knowledge, has not been previously described. This proposal is based on the consistent appearance of a unique luminescence lifetime within the specific pH window (7–8.5) predicted by the theoretical model to be dominated by higher-order polynuclear hydroxo species. We observe this new, unique lifetime whose pH stability range matches this prediction. Its spectral profile, while similar to other hydroxo complexes, is distinct enough to be resolved through deconvolution. The short lifetime is consistent with a complex that may retain a higher number of quenching water molecules in its coordination sphere compared to other hydroxo complexes. We acknowledge the short lifetime suggests a hydrated complex, consistent with its role as a hydrolysis intermediate. Furthermore, we note that the solid-phase analysis (schoepite) is consistent with the solution chemistry leading to polynuclear species, providing indirect support for the formation of such complexes. In contrast, under atmospheric conditions, carbonate complexation dominated due to atmospheric CO2. The preliminary carbonato species of [(UO2)2CO3(OH)3]− (decay time—see below) was previously characterized computationally and by ATR-FTIR spectroscopy [63]. This uranyl carbonato complex exhibits spectral characteristics nearly identical to the [(UO2)3(OH)5]+ complex described earlier. However, it displays variable luminescence lifetimes across its stable pH range (figure 7). This variability likely arises from the rearrangement of water molecules among different configurations of the same carbonato complex, supported by the observation of discrete lifetime values.
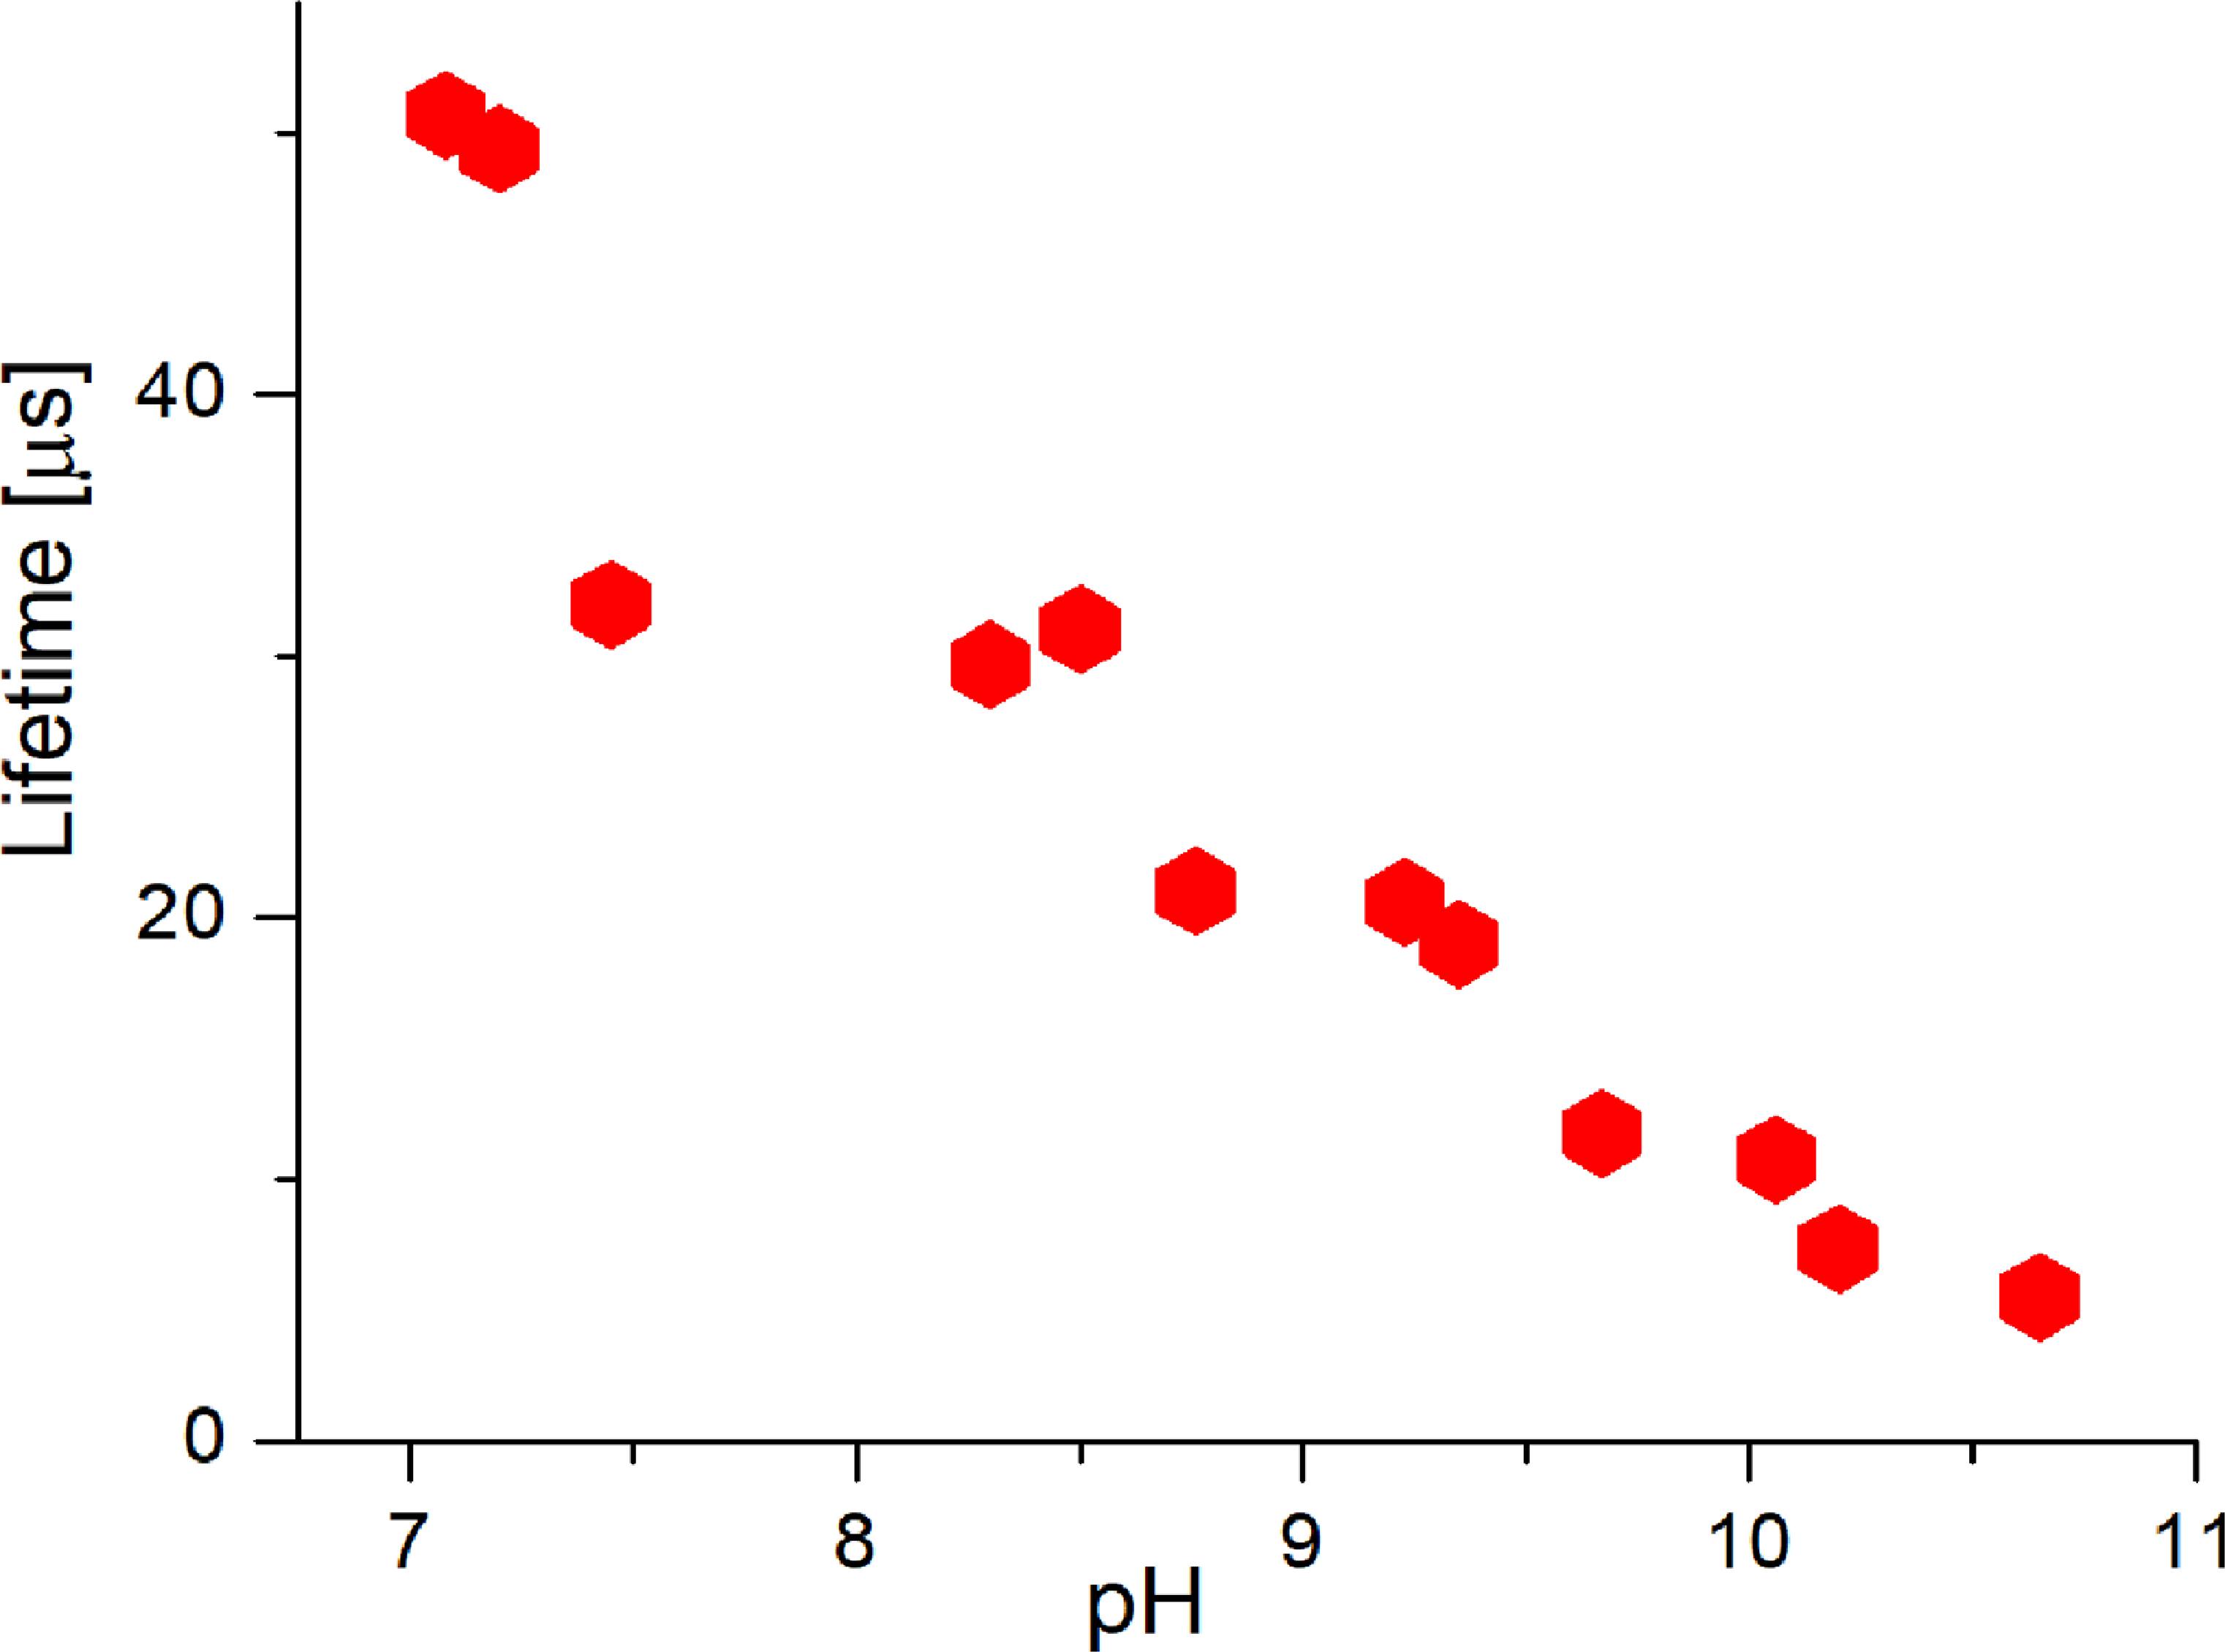
Figure 7. LL of the [(UO2)2CO3(OH)3]– complex as a function of pH.
Download figure:
Standard image High-resolution imageAdditionally, the [(UO2)3(OH)5]+ complex remained detectable spectroscopically, though with a longer decay time (16.0 ± 0.7 μs) than observed in more acidic solutions. that was determined in more acidic environment. Representative spectral data for pH 6.5 under atmospheric conditions and its deconvolution into individual complexes are presented in figure 8.
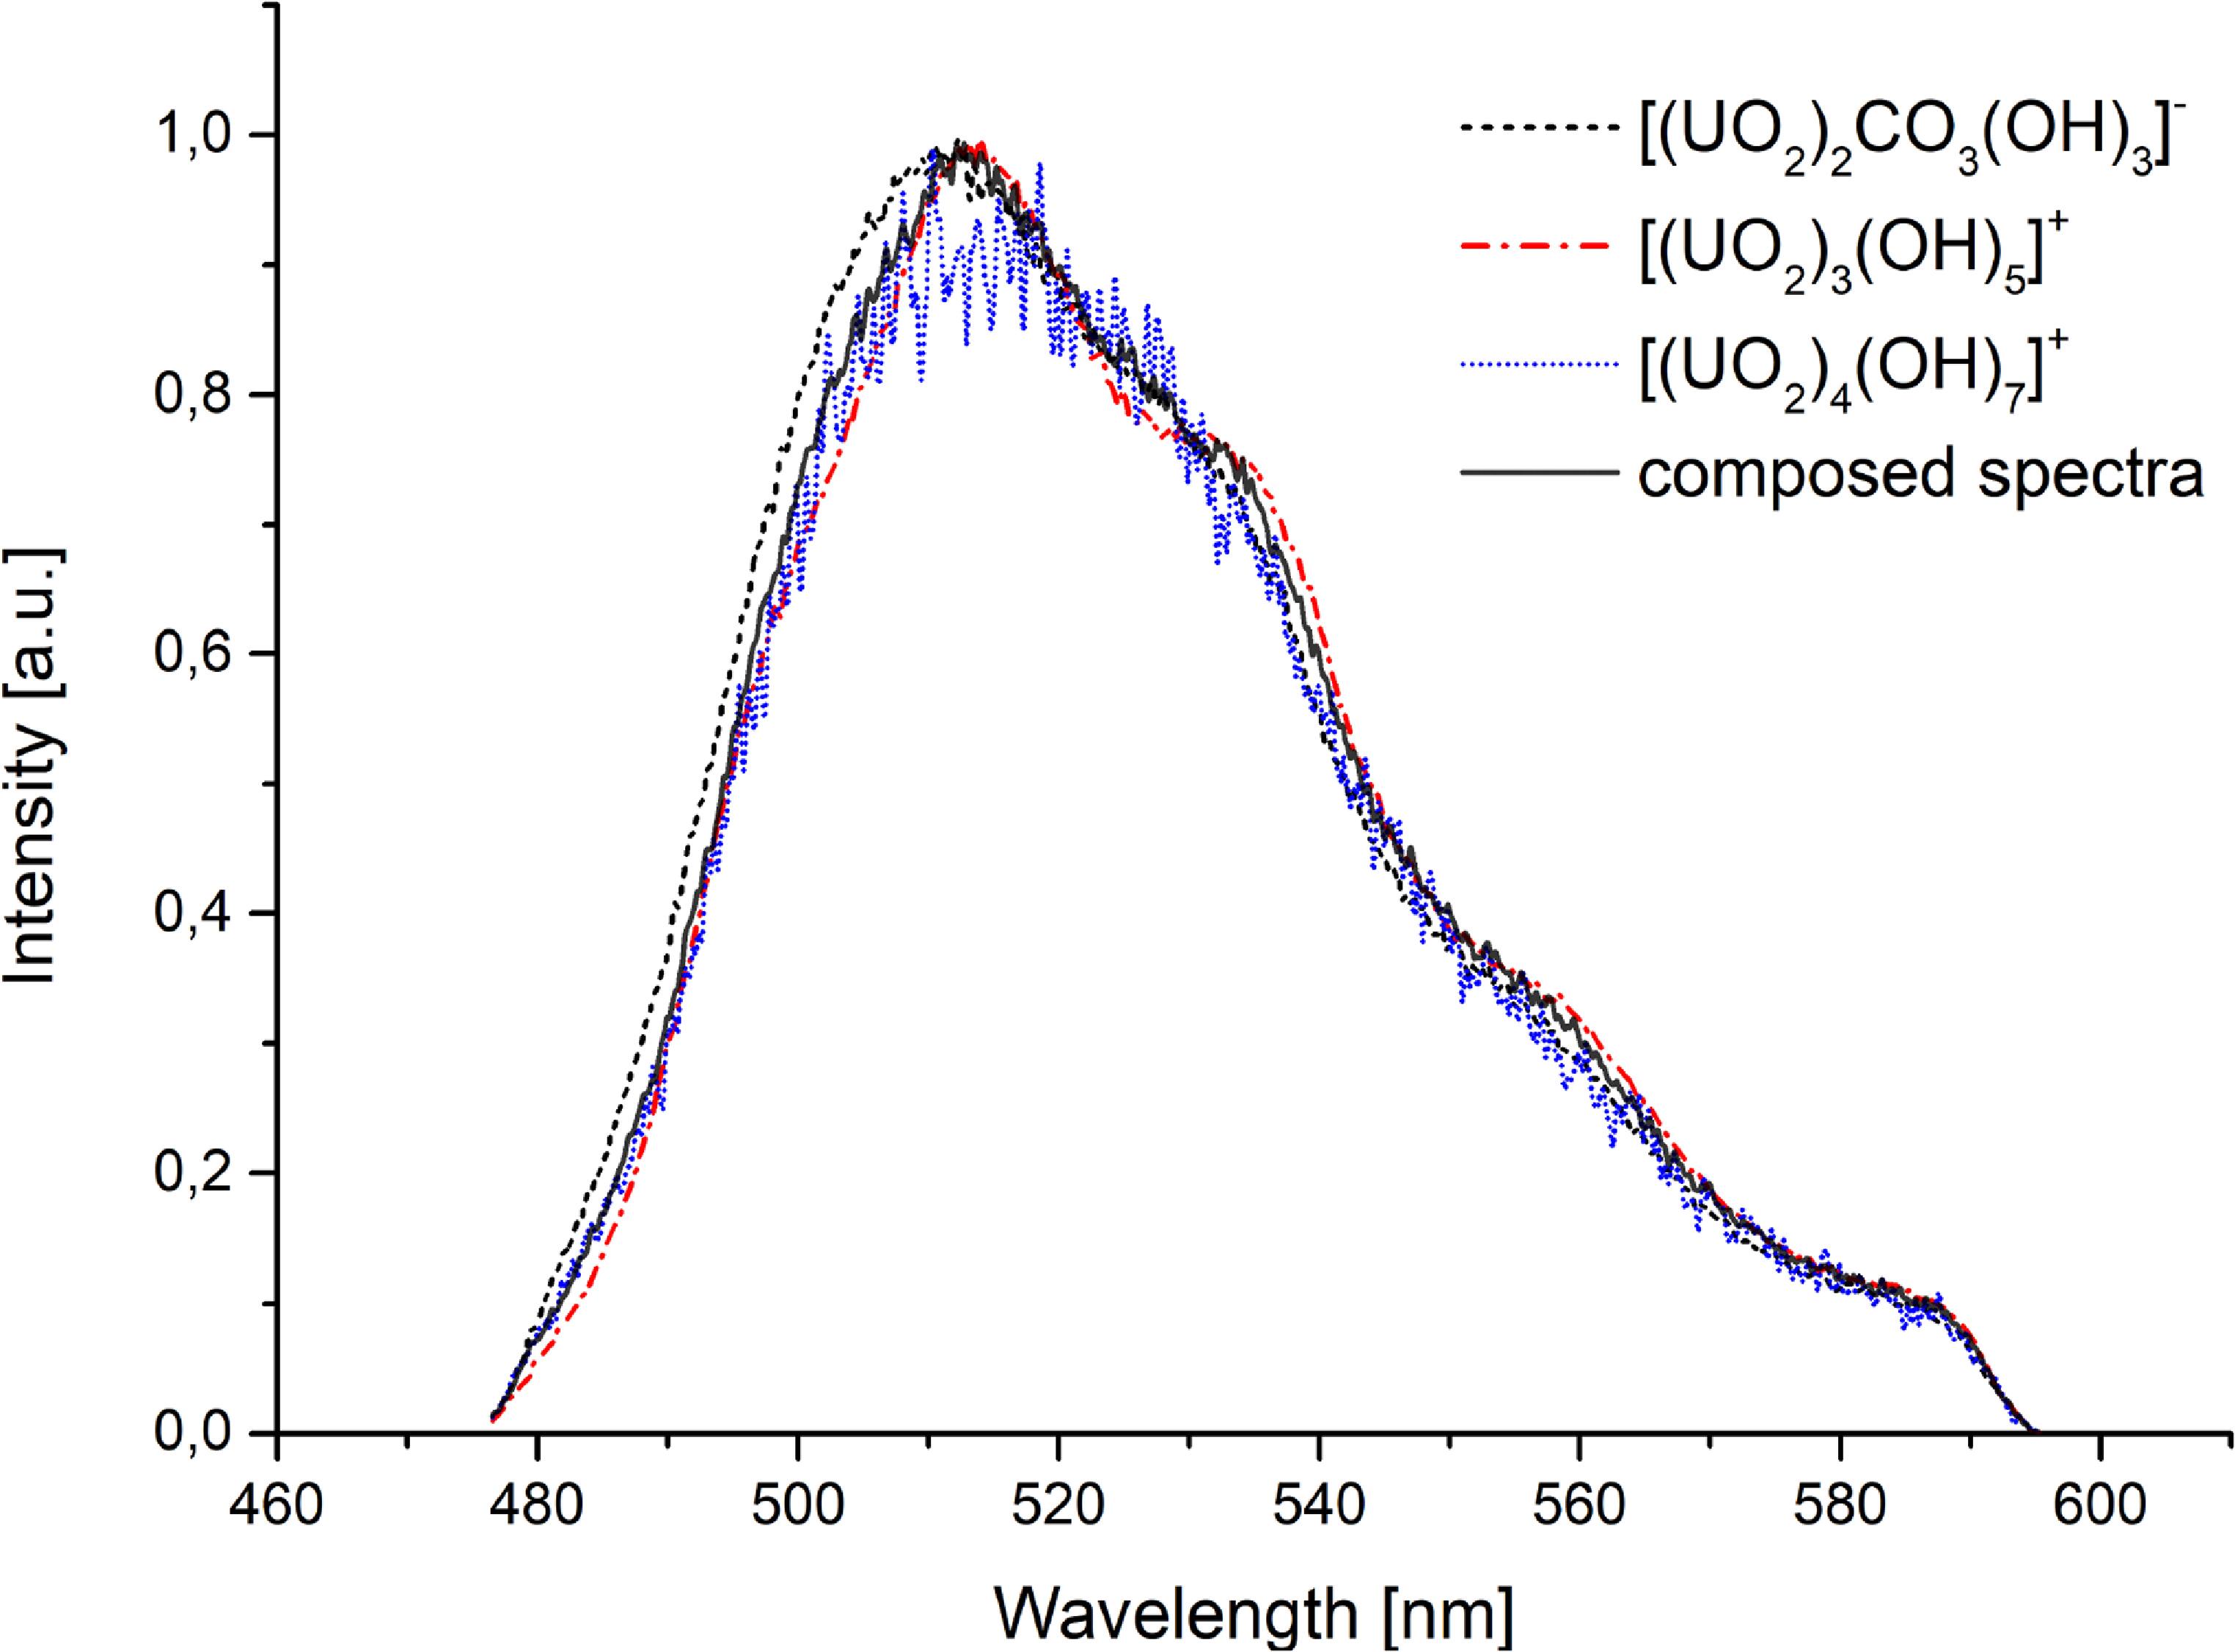
Figure 8. Spectral characteristic and deconvolution of individual complexes for pH 6.5 solution.
Download figure:
Standard image High-resolution imageUranium(VI) speciation study in the range of 8,6 < pH < 13
In carbonate-free systems at pH > 10, the predominant species is [UO2(OH)3]–, which exhibits LL of 0.17 ± 0.05 μs. Figure 9 displays the spectral profile at pH 10.5 and deconvolution of the composed integral spectra into components assigned to individual complexes. As pH increases above 10.5, spectral features exhibit minimal change; however, the relative luminescence intensity progressively decreases. At pH 12.7 the signal intensity was insufficient for mathematical analysis (figure 10). No observable luminescence occurred at 13.0 which is consistent with speciation diagrams indicating dominance of the non-luminescent [UO2(OH)4]2− species at room temperature.
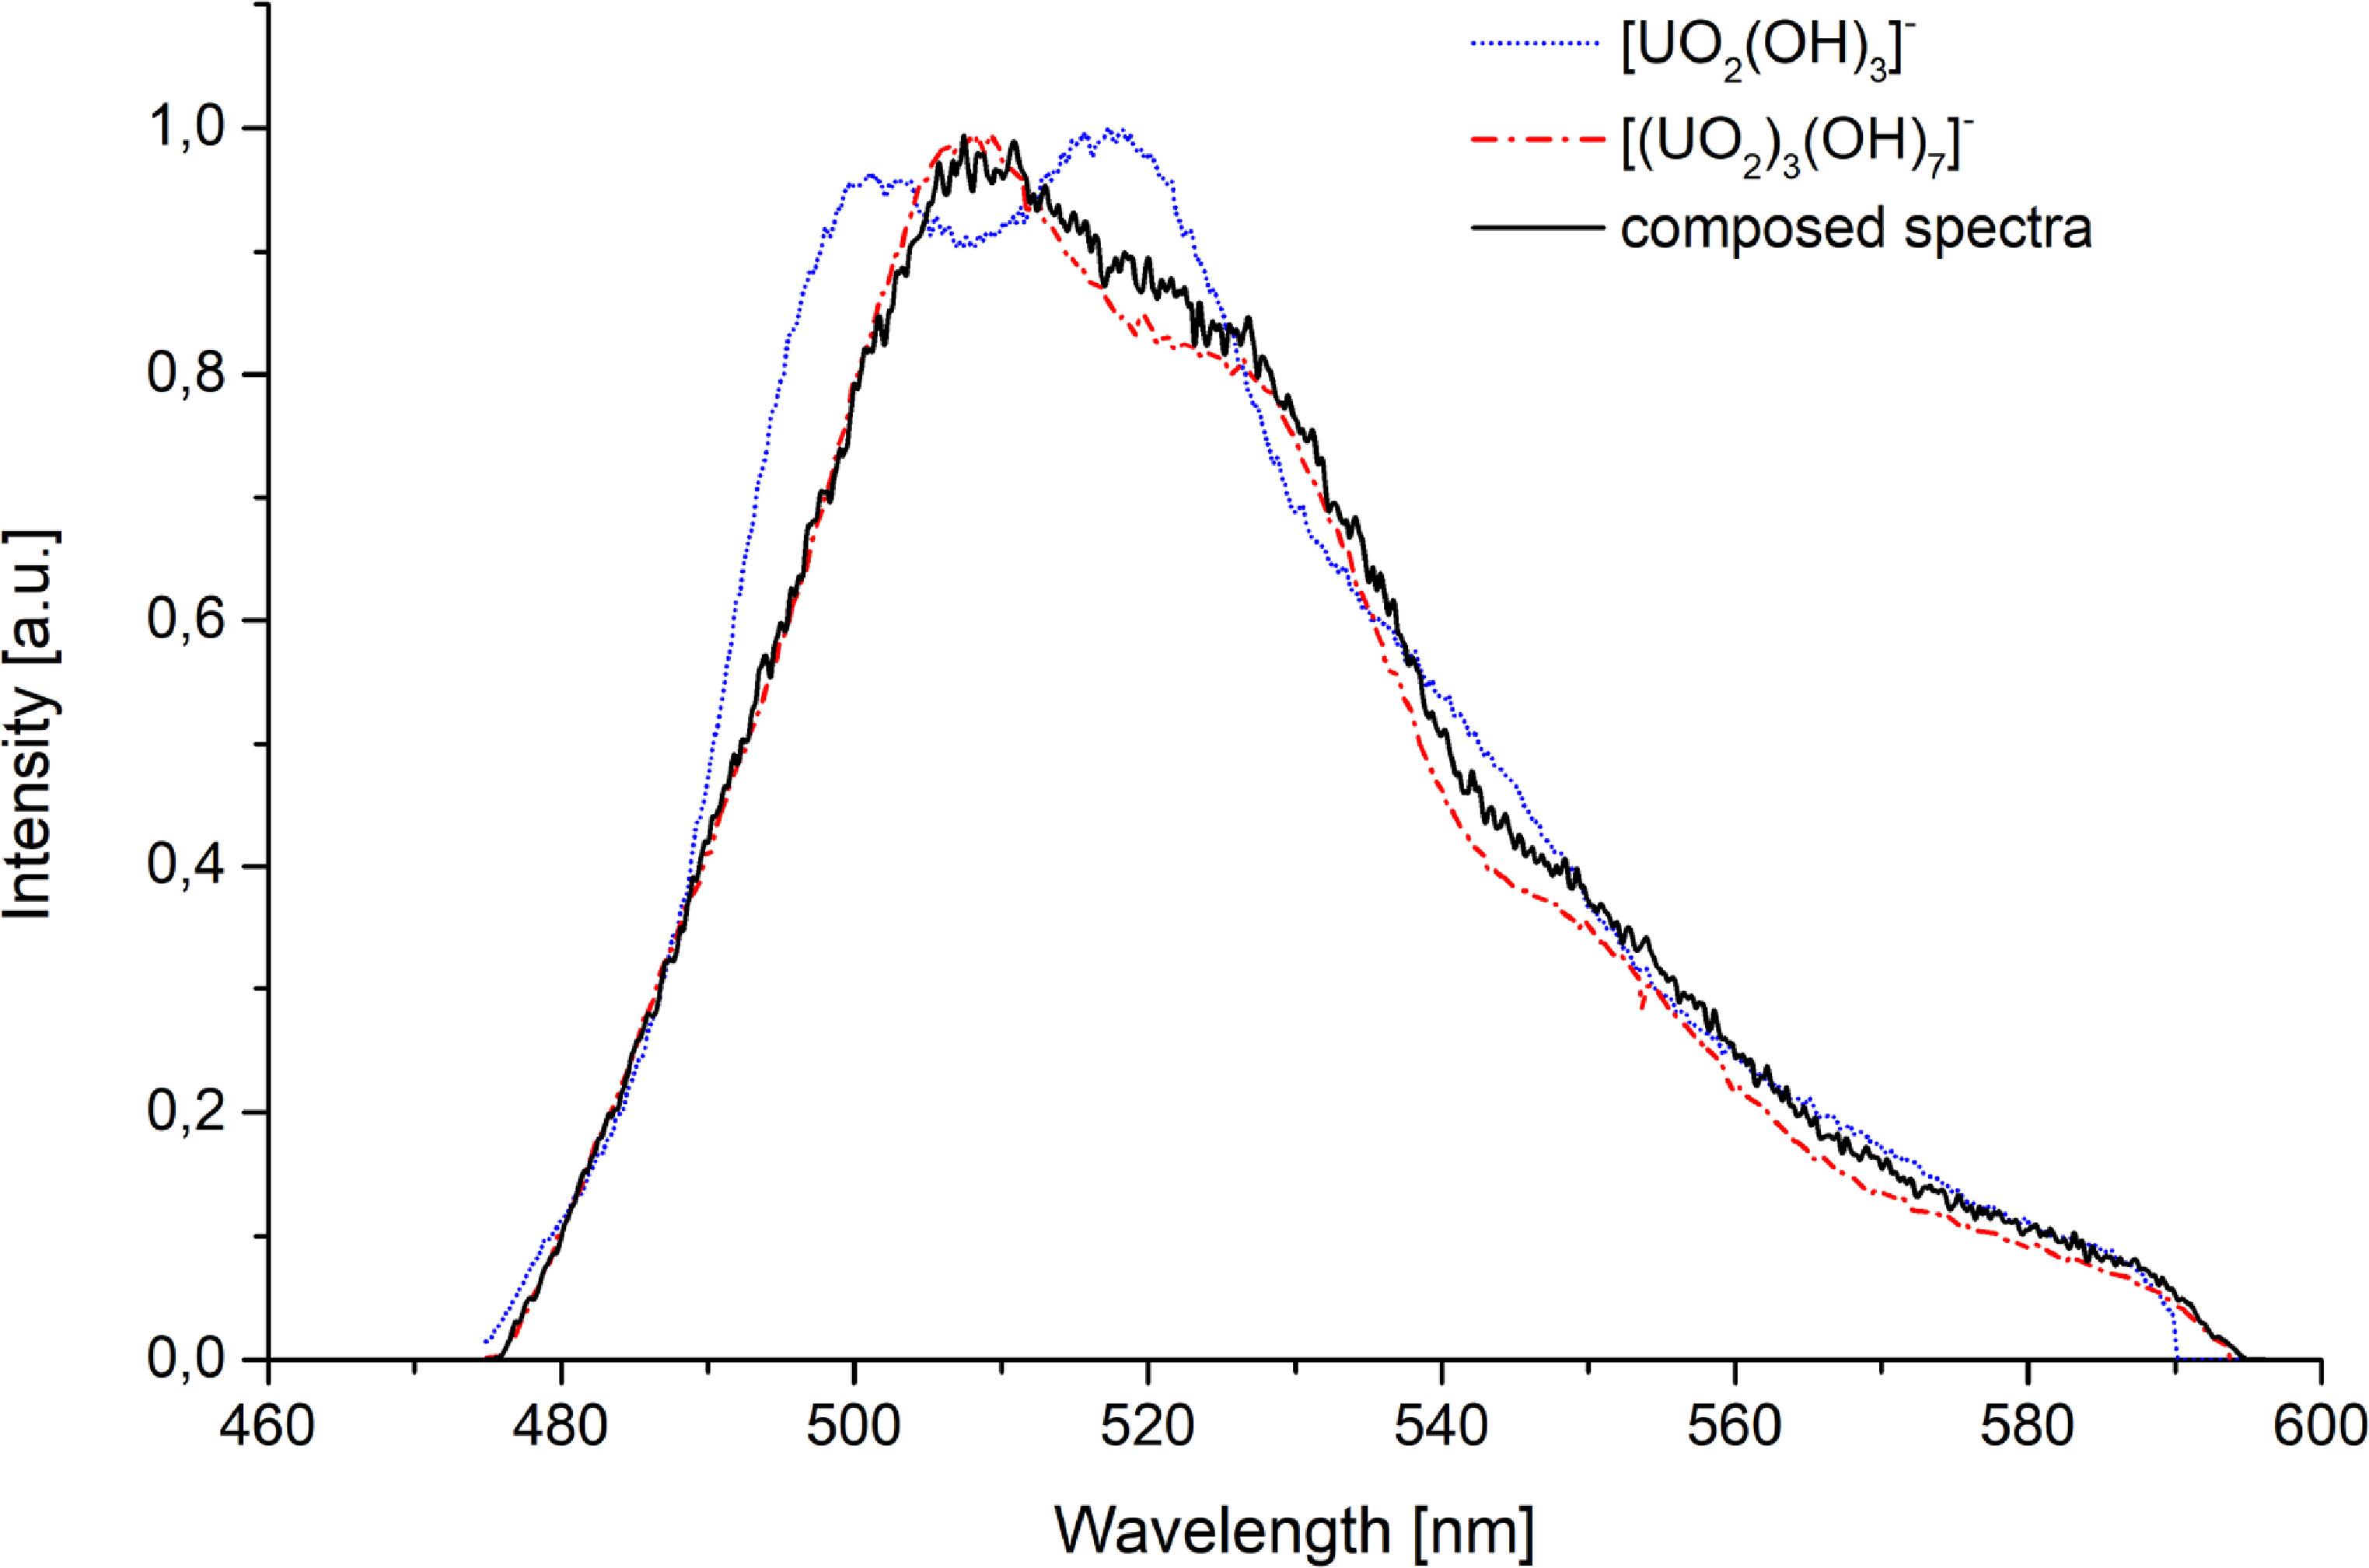
Figure 9. Spectral characteristic and deconvolution of combined spectra assigned to individual complexes at pH 10.5.
Download figure:
Standard image High-resolution image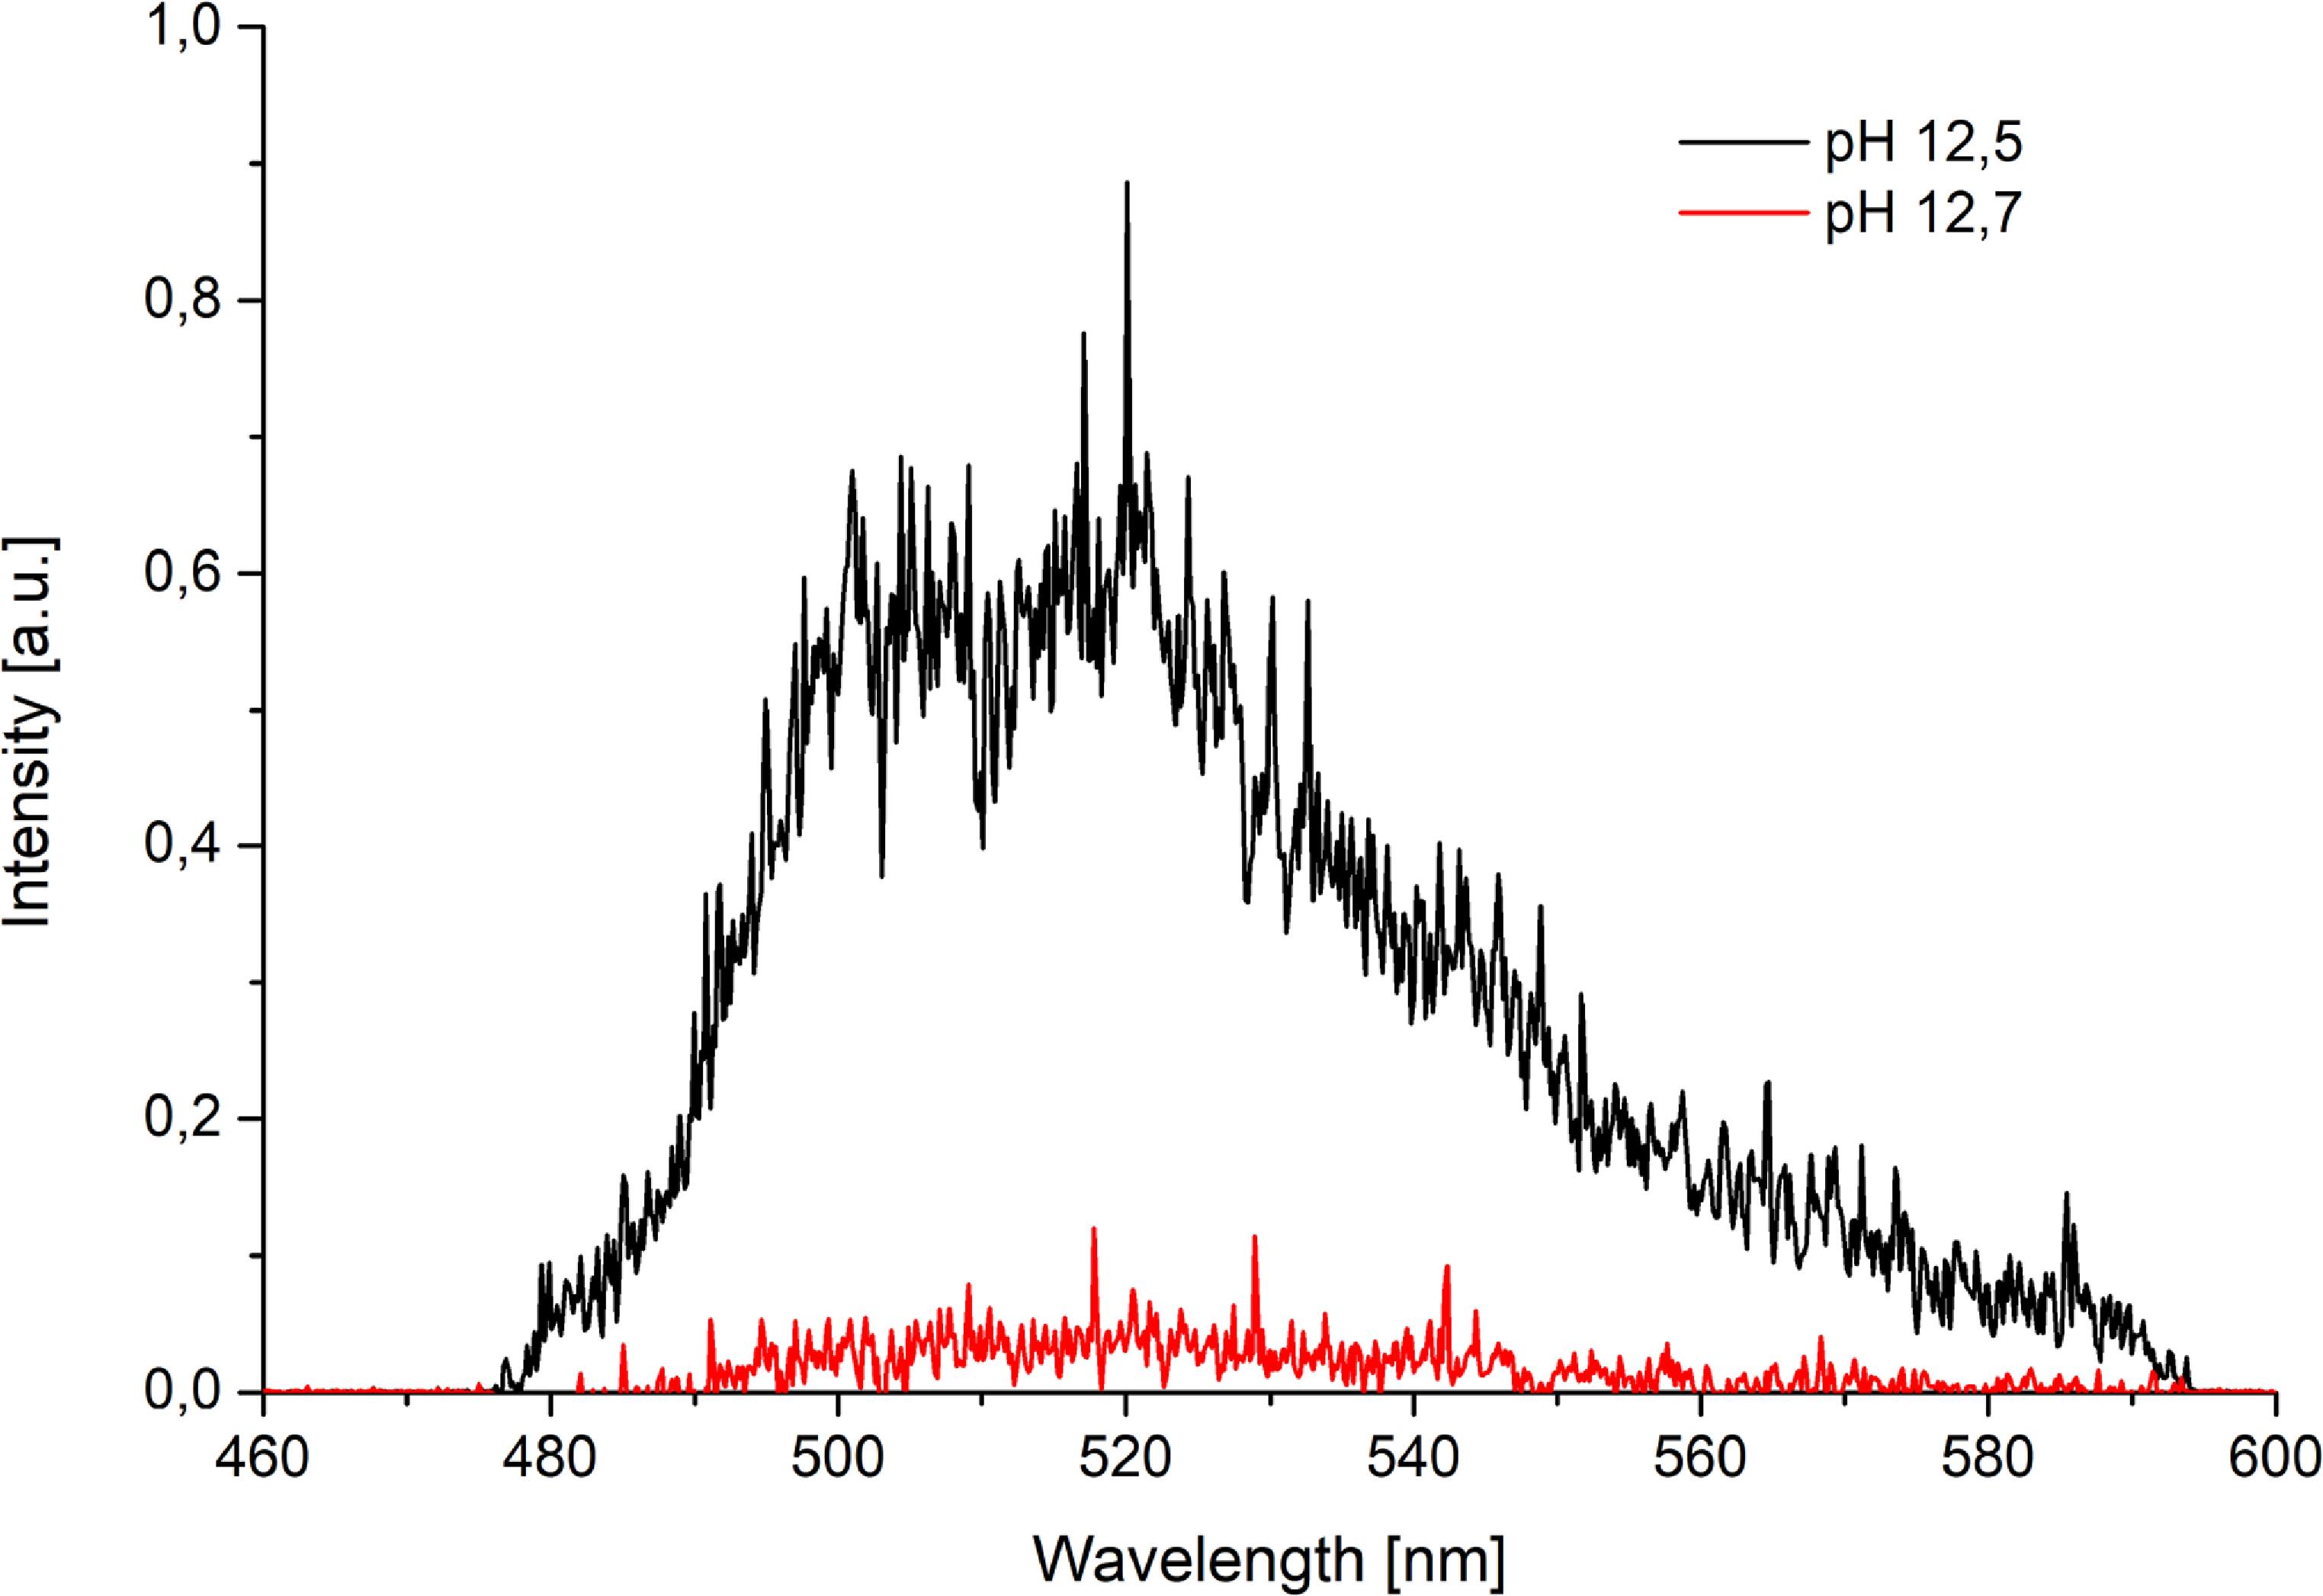
Figure 10. Comparison of luminescence intensities of [UO2(OH)3]– at varying pH levels.
Download figure:
Standard image High-resolution imageUnder atmospheric conditions, carbonate complexes dominate speciation. The pre-dominant tris(carbonato) complex [UO2(CO3)3]4−, exhibits very weak luminescence signal at room temperature and LL could not be determined. To quantify carbonate complexation kinetics, samples initially prepared under inert atmosphere at pH 11.6 were exposed to air. Luminescence spectra recorded at regular intervals revealed that the transformation from hydroxo to carbonato complexes proceeds relatively slowly, on the timescale of several hours. This slow kinetics enabled the detection of intermediate hydroxo species, specifically [(UO2)4(OH)7]+ and [UO2(OH)3]−, following atmospheric exposure.
Summary on formation and characteristics of U(VI) carbonato complexes
Based on our findings, the formation of uranyl carbonato complexes is not a simple, direct process but rather one that is highly dependent on pH and, critically, on atmospheric conditions. The data suggests a dynamic system where carbonato complexes compete with and eventually dominate over hydroxo species.
The primary driver of this change is the introduction of atmospheric CO2. Under inert conditions (e.g., N2 atmosphere), hydroxo complexes dominate even at higher pH. Upon exposure to air, CO2 dissolves to form carbonate (CO32−) and bicarbonate (HCO3−) ions, which readily complex with the positively charged uranyl ion (UO22+). Carbonato complexes become significant in the pH range of ~7 to 13, outcompeting the hydrolyzed species. Their stability and type change with increasing pH.
We propose the formation of the [(UO2)2CO3(OH)3]− complex. This assignment is supported by preliminary speciation calculations and a reference to prior characterization via ATR-FTIR spectroscopy and computational methods [54]. This complex is a mixed hydroxo-carbonato polynuclear species. Its formation can be thought of as a carbonate ion displacing water and/or hydroxide ligands in existing polynuclear hydroxo complexes like [(UO2)3(OH)5]+.
A crucial finding from your data is the complex luminescence behavior. There is a spectral similarity of the [(UO2)2CO3(OH)3]− to the hydroxo complex [(UO2)3(OH)5]+. This makes pure spectral deconvolution challenging. The key to identification is its luminescence lifetime (decay time), which is not a single value but is ‘variable across its stable pH range.’ The study reports the observation of ‘discrete lifetime values.’
While the deconvolution of TRLFS spectra provides a robust interpretation consistent with our theoretical models and XRD data, we acknowledge that the identification or proposal of certain complexes, particularly those with similar spectral signatures, would benefit from further validation by complementary techniques.
The proposed hypothesis is that this variability is attributed to a rearrangement of water molecules among different configurations (e.g., different hydration states or isomeric forms) of the same chemical complex, [(UO2)2CO3(OH)3]−. This implies a dynamic equilibrium where water molecules in the first coordination sphere exchange or reposition, affecting the non-radiative decay pathways and thus altering the measured lifetime without changing the core chemical identity.
A critical insight from our study is the slow kinetics of the process. The transformation speed from hydroxo to carbonato complexes after air exposure is ‘relatively slow, on the timescale of several hours.’ This slow kinetics allowed for the spectroscopic detection of intermediate hydroxo species ([(UO2)4(OH)7]+ and [UO2(OH)3]−) even after atmospheric exposure. This suggests that the carbonate complexation is not instantaneous but involves relatively slow ligand exchange reactions at the uranium center. At very high pH ( > ~10.5) under atmospheric conditions, the tris(carbonato) complex, [UO2(CO3)3]4−, becomes dominant, as predicted by speciation diagrams. This complex exhibits ‘very weak luminescence signal at room temperature,’ making its lifetime impossible to determine with your setup. This is a well-known characteristic of this species.
Comparison of our data with the literature
The findings we describe are supported by and contribute to the existing body of literature on uranyl carbonate complexation. A study by Bernhard et al (2001) precisely characterized this complex using time-resolved laser-induced fluorescence spectroscopy (TRLFS), the same technique your study seems to use. They identified [(UO2)2CO3(OH)3]− in the pH range 6–9 and reported its characteristic fluorescence emission bands and lifetime [64].
On LL variability and water rearrangement, our hypothesis that water rearrangement causes lifetime variability in structurally similar complexes is a sophisticated and plausible explanation that finds echo in advanced literature. The concept of dynamic hydration spheres affecting luminescence is discussed in uranium spectroscopy. While a direct reference for your exact complex might be niche, the principle is sound. Tsushima et al (2010) provides a study of uranyl luminescence, explaining how the number and binding strength of water molecules in the coordination sphere; which are the primary quenching mechanism. Different hydration states of the same core complex could indeed lead to discrete lifetimes [65].
The weak luminescence of [UO2(CO3)3]4− is universally accepted and cited in nearly all reviews on uranium spectroscopy. The symmetric coordination of three bidentate carbonate ligands efficiently quenches the luminescent excited state through vibrational energy transfer [66].
3.3. Uranium concentration
As shown in the accompanying graph (figure 11), the luminescence intensity remained constant across the investigated pH range and correlated exclusively with the uranium concentration. All results were compiled into a graph illustrating the dependence of luminescence intensity on uranium concentration, revealing a linear relationship with a correlation coefficient (R2) of 0.99852. The data further confirm that the luminescence signal intensity is independent of the solution pH and depends solely on the uranium concentration.
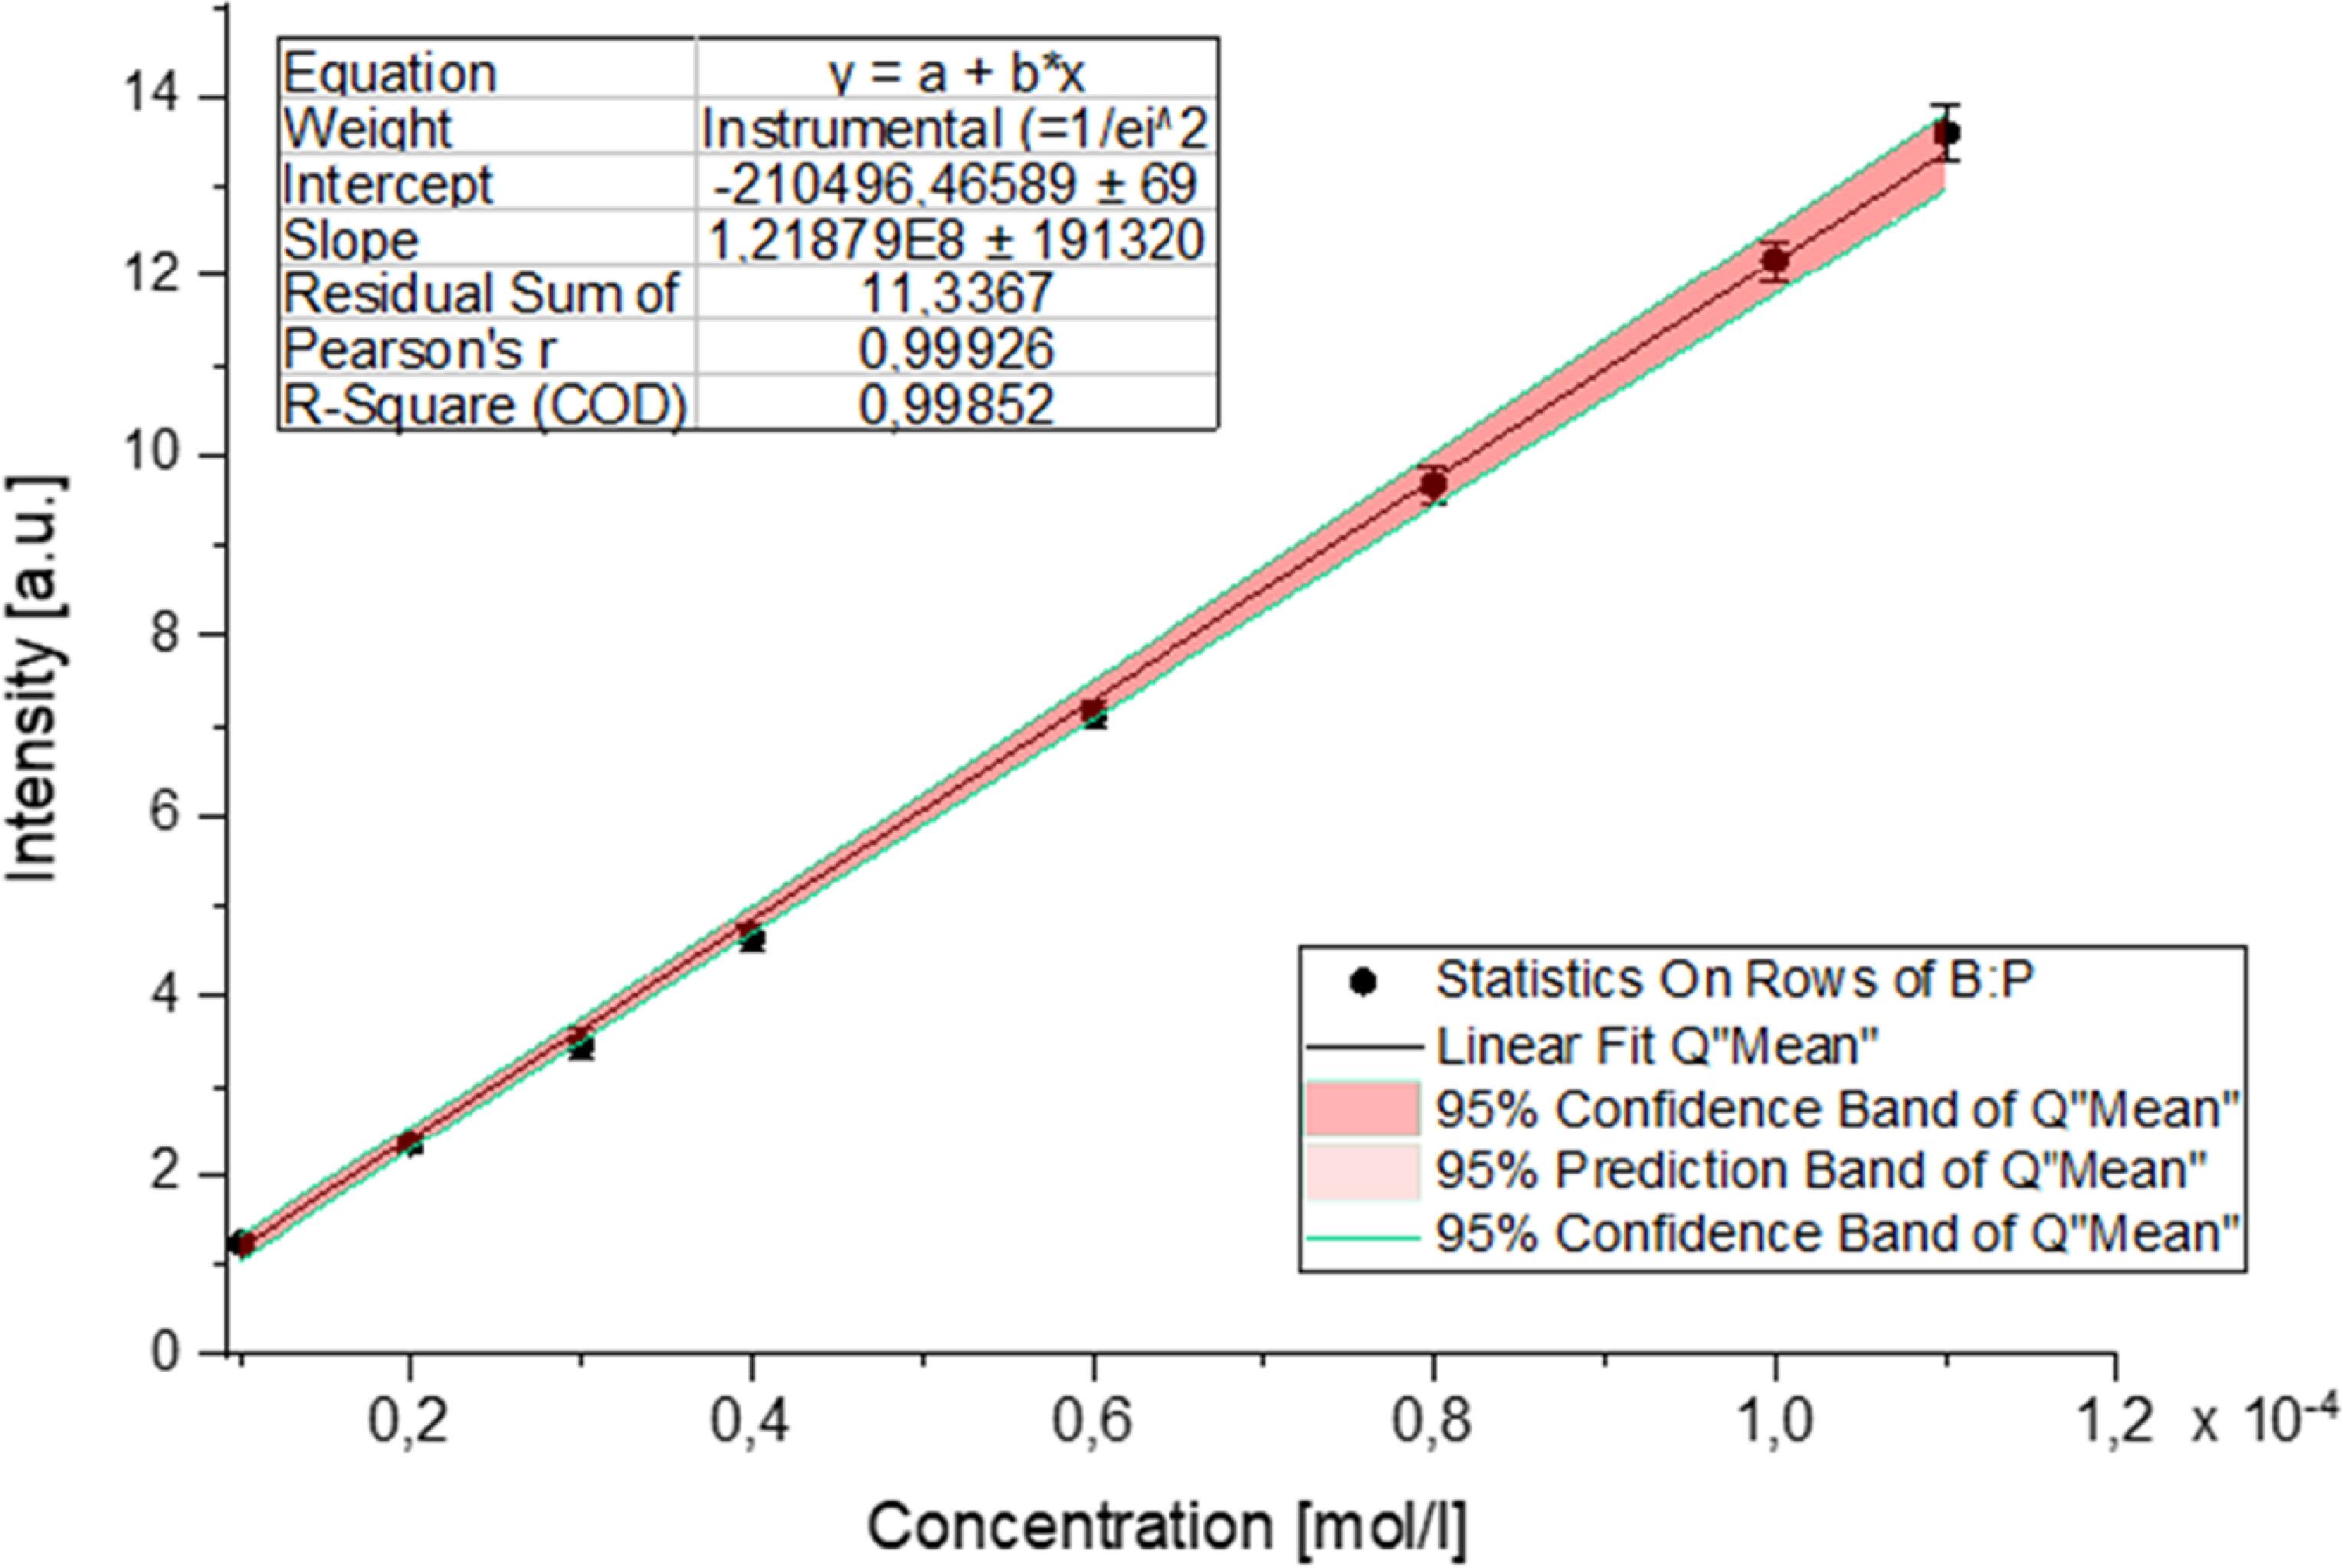
Figure 11. Luminescence intensity as a function of uranium concentration. The data presented reveal a linear relationship between luminescence intensity and uranium concentration, reinforced by a strong correlation coefficient (R2 = 0,99852).
Download figure:
Standard image High-resolution imageFigure 12 demonstrates that the luminescence intensity, which is a measure used in this study, remains approximately stable across a range of pH values for different uranium concentrations. This observed pH independence indicates that the measurement technique effectively isolates the uranium concentration signal from variations in solution acidity/basicity, confirming the methodology’s reliability for quantifying uranium concentration without pH interference.
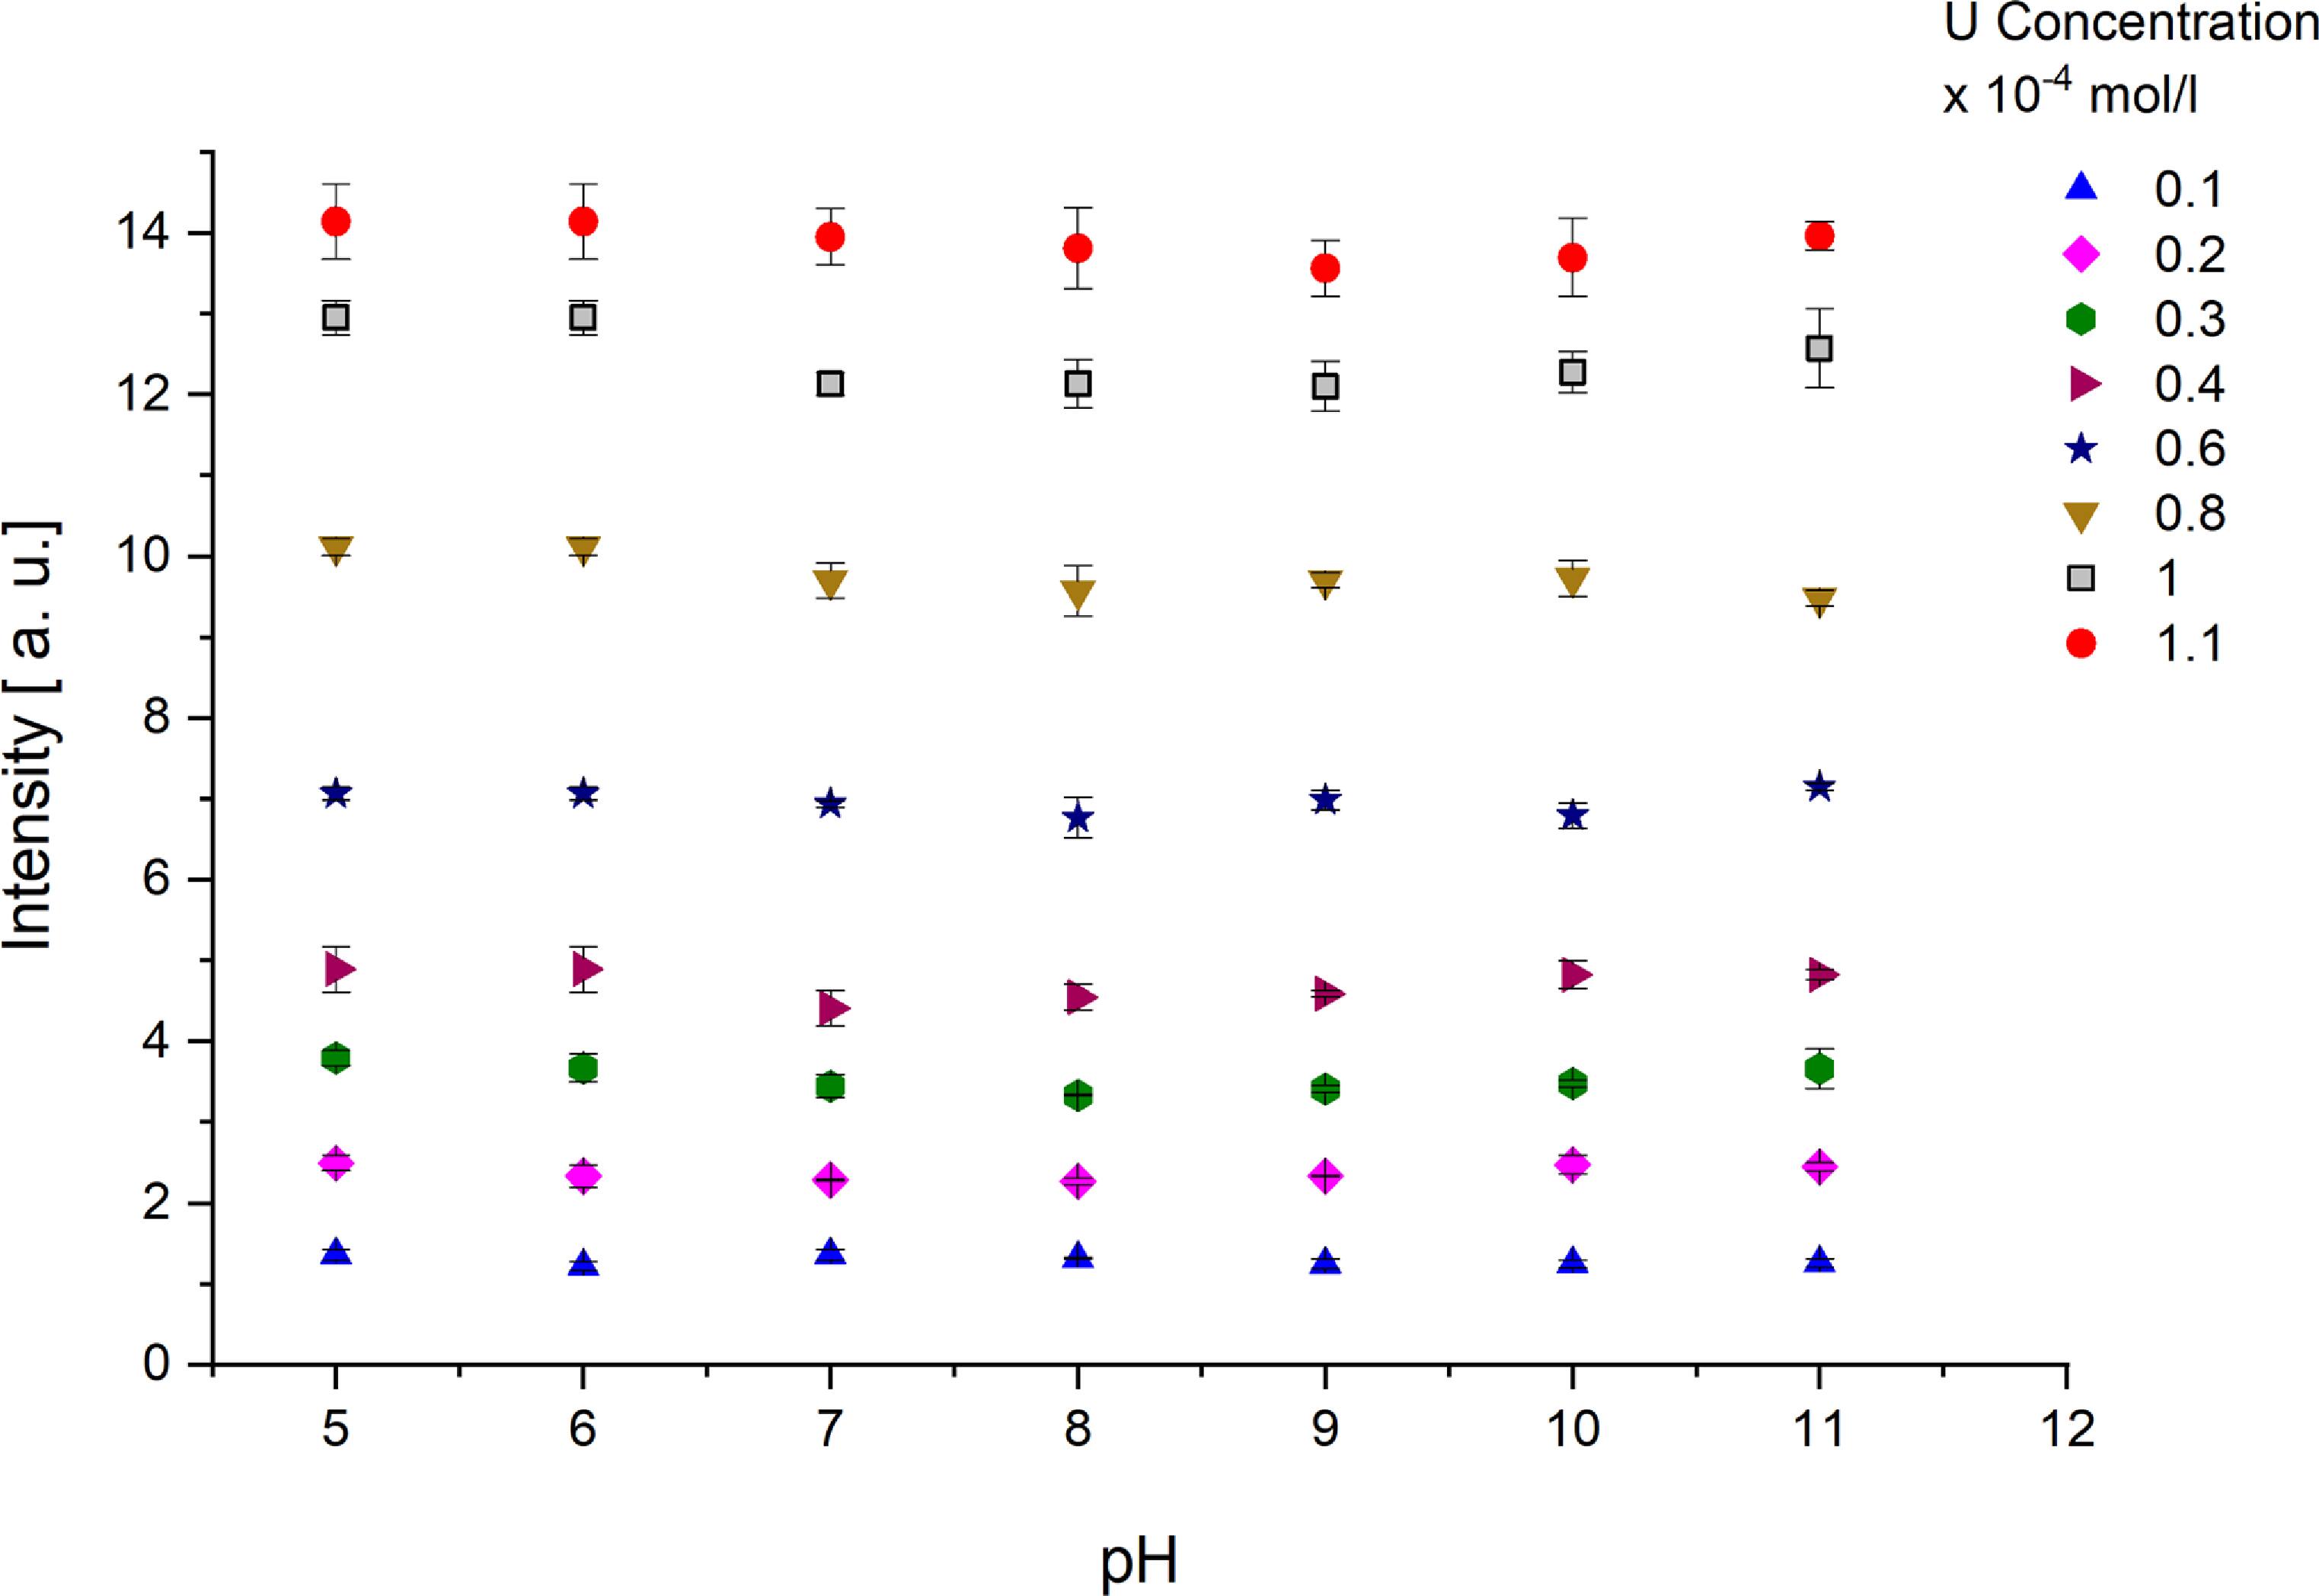
Figure 12. Luminescence intensity stability across pH at varying uranium concentrations.
Download figure:
Standard image High-resolution imageThe method for total uranium quantification was employed to determine the fraction incorporated into precipitates and assess precipitation kinetics. As shown in figure 13, precipitation was minimal under acidic conditions but extensive in alkaline media. Residual uranium concentrations decreased to 1%–4% of initial values after six months of aging. In order to evaluate the potential impact of sorption onto the walls on the results, the extent of this sorption was experimentally determined. The vessels were rinsed with 1 M HNO3 for 30 min and the amount of uranium in the rinsate was quantified using the method previously described. Sorption accounted for ≤2% of initial uranium (pH-dependent), confirming precipitation dominates uranium removal.
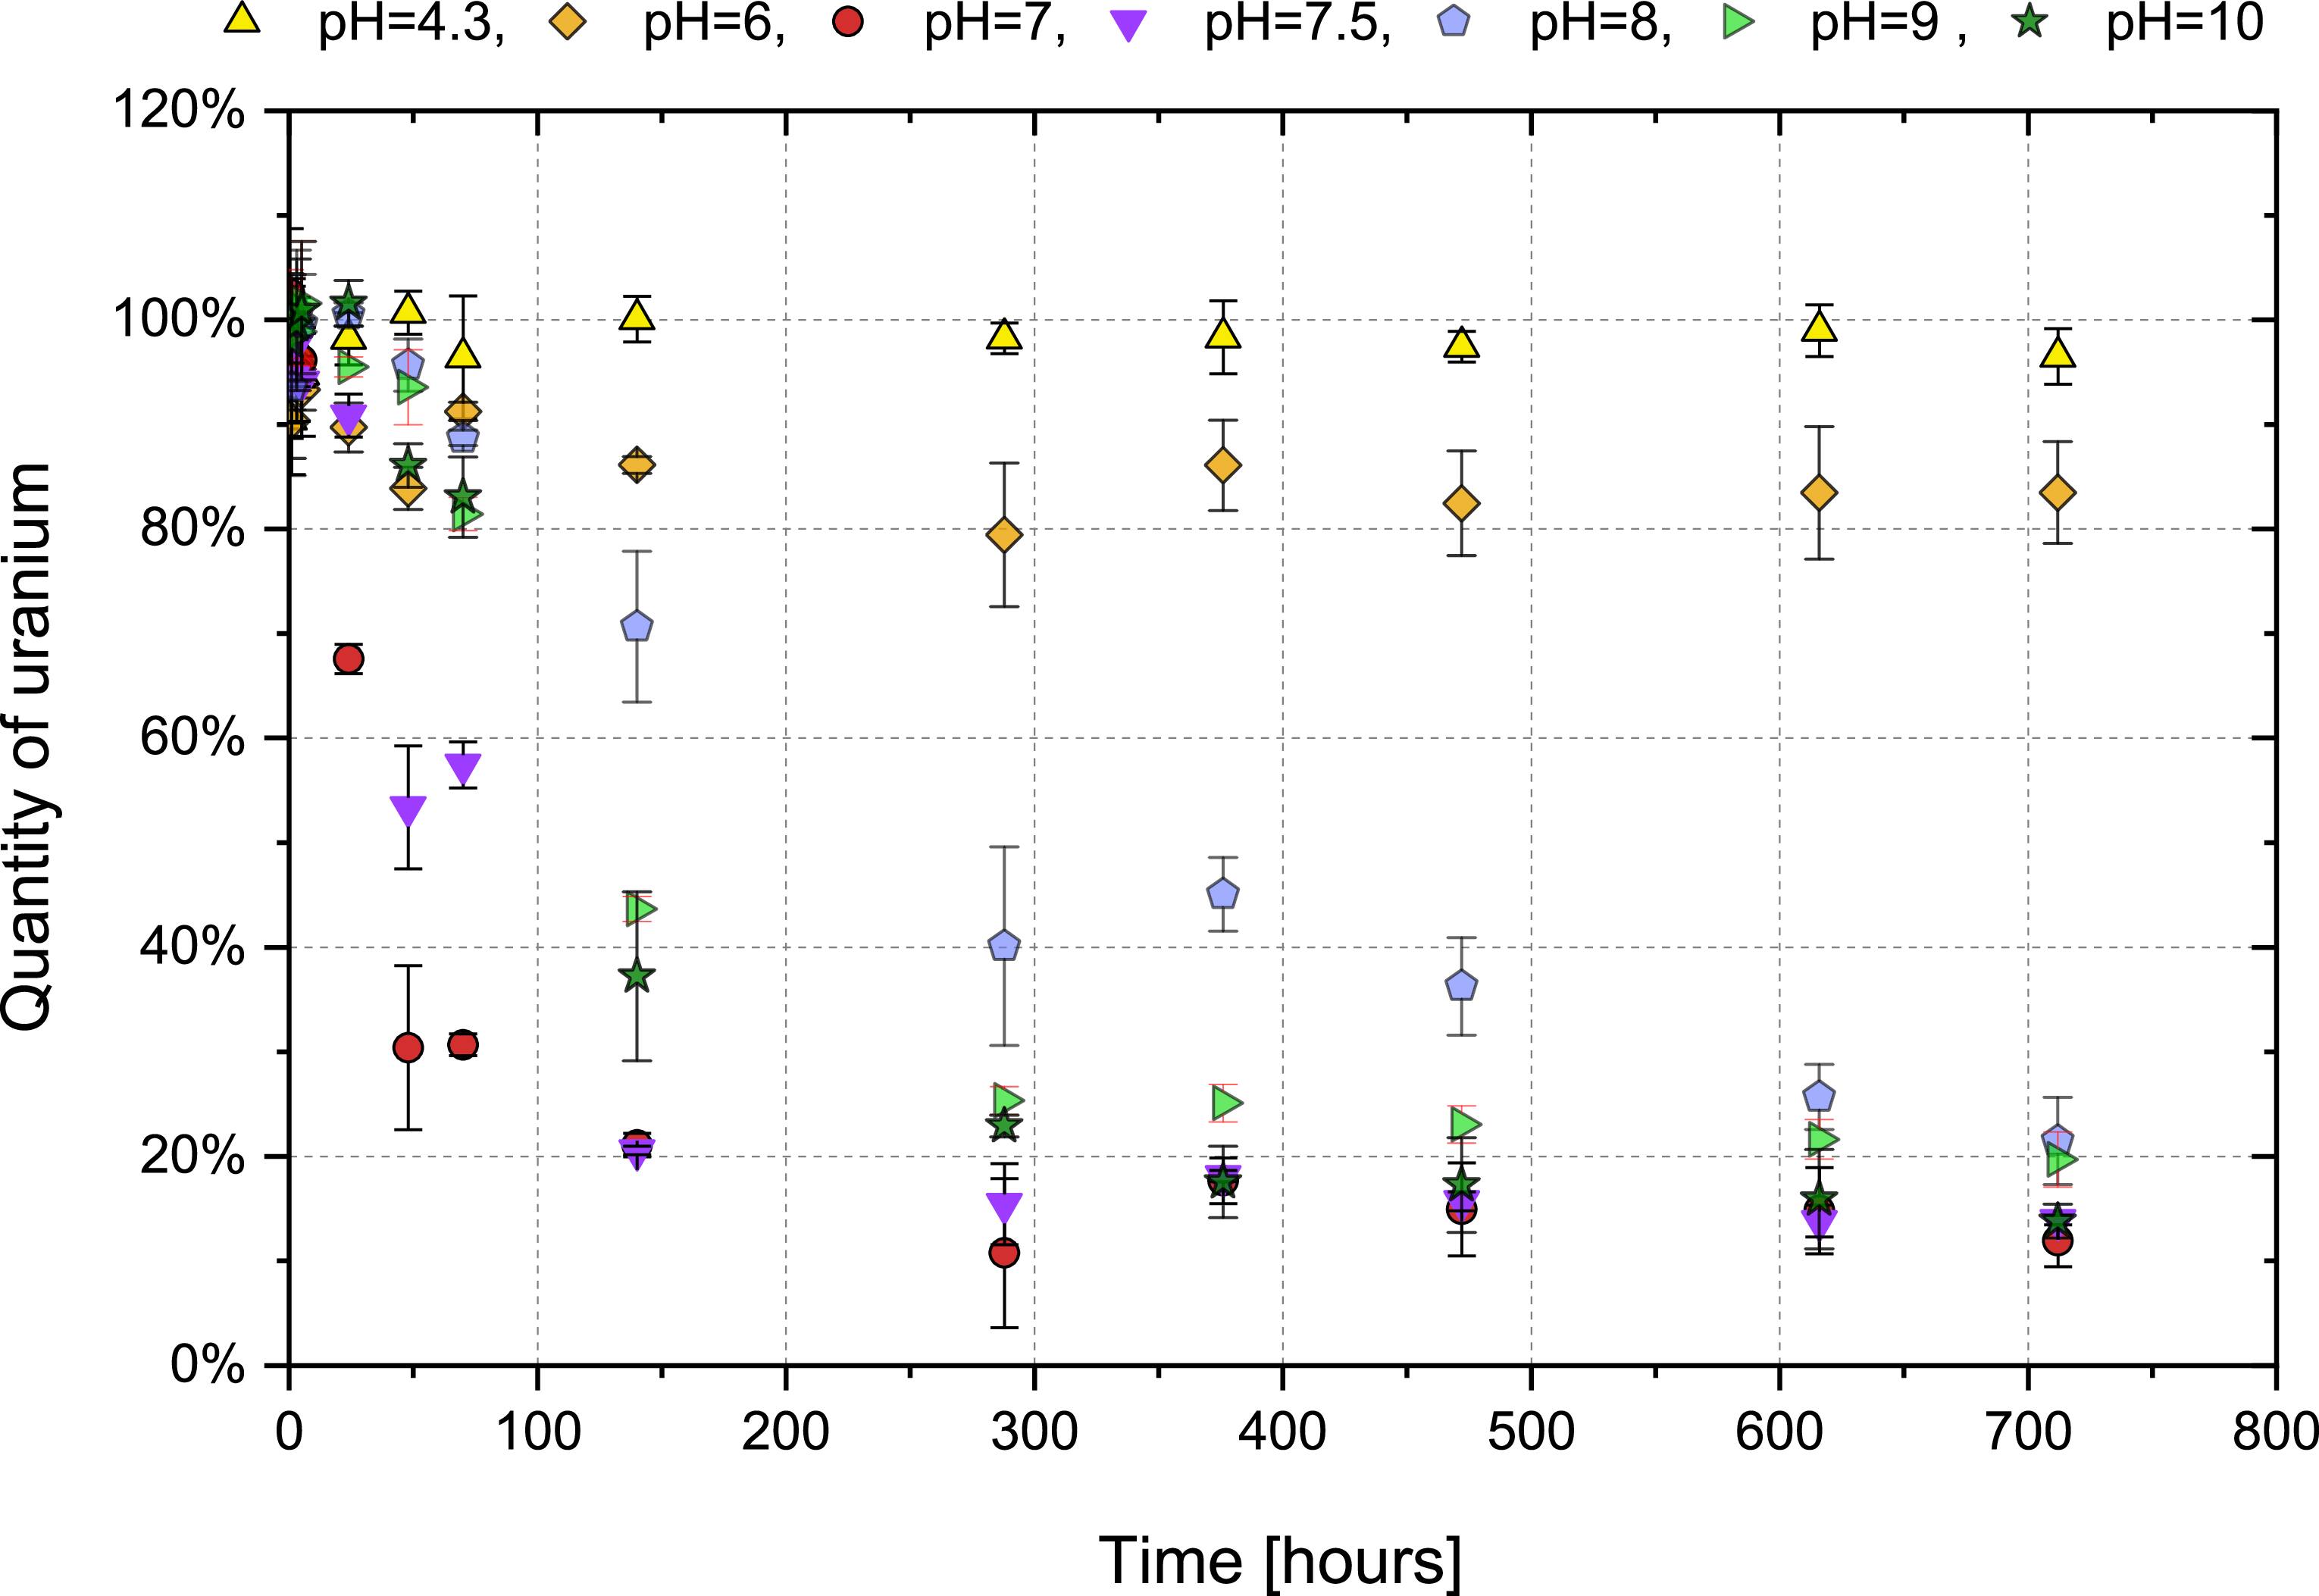
Figure 13. Evolution of residual uranium concentration in solution over time during precipitation.
Download figure:
Standard image High-resolution image4. Conclusions
This study combined theoretical modelling with experimental TRLFS measurements to investigate uranium(VI) speciation in aqueous solutions across a broad pH range (4.3–13.0), with a focus on alkaline conditions relevant to cementitious environments in deep geological repositories. Theoretical speciation diagrams were constructed for uranium concentrations of 10–5 to 10–3 M, and experimental TRLFS data were collected at 10–4 M to ensure consistency and comparability.
Distinct uranium(VI) species were identified based on their luminescence lifetimes and spectral characteristics, including UO22+, [UO2OH]+, [(UO2)2(OH)2]2+, [(UO2)3(OH)5]+, [(UO2)3(OH)7]−, (UO2)2CO3(OH)3−, [(UO2)4(OH)7]+, and [UO2(OH)3]−. The non-luminescent [UO2(OH)4]2− species was inferred at high pH. While the emission spectra of these species were often similar, their luminescence lifetimes varied significantly, suggesting differences in the first coordination sphere—likely due to rearrangements of water molecules or ligand exchange processes. These findings help explain the variability in reported lifetimes across the literature.
Critically, luminescence intensity was shown to be independent of pH and linearly correlated with uranium concentration, confirming laser-induced luminescence is a reliable and sensitive method for uranium quantification in complex geochemical environments. The dynamics of complex formation were investigated, and the degree of precipitation was quantified. This work advances the understanding of uranium(VI) speciation under alkaline conditions and supports the development of more accurate models for radionuclide transport in nuclear waste disposal systems. These findings are also of practical importance for the design and interpretation of experimental studies.
Acknowledgments
This research was funded by the Technology Agency of the Czech Republic under project No. SQ01010267, aimed at ‘Determining the concentration of heavy metals in environmental samples for the assessment and characterization of ecological burdens.’ We would also like to express our gratitude to the Faculty of Nuclear Sciences and Physical Engineering, Department of Nuclear chemistry for the support.
Conflict of interest statement
The authors have no competing interests to declare that are relevant to the content of this article.
Data availability statement
The data that support the findings of this study are openly available at the following URL/DOI: https://doi.org/10.5281/zenodo.15987940.