Abstract
In 2020, the Super-Kamiokande (SK) experiment moved to a new stage (SK-Gd) in which gadolinium (Gd) sulfate octahydrate was added to the water in the detector, enhancing the efficiency to detect thermal neutrons and consequently improving the sensitivity to low energy electron anti-neutrinos from inverse beta decay (IBD) interactions. SK-Gd has the potential to provide early alerts of incipient core-collapse supernovae through detection of electron anti-neutrinos from thermal and nuclear processes responsible for the cooling of massive stars before the gravitational collapse of their cores. These pre-supernova neutrinos emitted during the silicon burning phase can exceed the energy threshold for IBD reactions. We present the sensitivity of SK-Gd to pre-supernova stars and the techniques used for the development of a pre-supernova alarm based on the detection of these neutrinos in SK, as well as prospects for future SK-Gd phases with higher concentrations of Gd. For the current SK-Gd phase, high-confidence alerts for Betelgeuse could be issued up to 9 hr in advance of the core collapse itself.
Original content from this work may be used under the terms of the Creative Commons Attribution 4.0 licence. Any further distribution of this work must maintain attribution to the author(s) and the title of the work, journal citation and DOI.
1. Introduction
The first observation of neutrinos produced outside of our solar system happened on 1987 February 23, due to a neutrino burst from a supernova explosion known as SN 1987A in the Large Magellanic Cloud, located approximately 50 kpc (163,000 lt-yr) from Earth. While this supernova—the first to be observed in the vicinity of our own galaxy since the invention of the telescope—was initially detected via its emitted visible light, signals from the corresponding neutrino burst were found in recorded data to have arrived several hours earlier (Hirata et al. 1988; Haines et al. 1988; Alexeyev et al. 1988; Aglietta et al. 1987); the neutrinos are generated before the majority of the electromagnetic radiation. SN 1987A remains the only observation of supernova neutrinos in history. Since then, a variety of more modern experiments with advantages such as greater longevity, increased target mass, lower energy threshold, and improved energy and timing resolution have come online (e.g., Super-Kamiokande (SK), Fukuda et al. 2003), IceCube (Aartsen et al. 2017), Kamioka Liquid Scintillator Antineutrino Detector (KamLAND; Eguchi et al. 2003), SNO+ (Albanese et al. 2021), etc., each hoping to efficiently detect supernova neutrino bursts and possibly provide early alerts for the delayed electromagnetic signal.
The SK experiment (Fukuda et al. 2003), located in the Kamioka mine in Japan, has the potential of detecting low energy (above a few megaelectronvolts) neutrino bursts from supernova explosions in our galaxy and its surroundings. The neutrino elastic scattering interaction is a subdominant (around 3% of all events) but important interaction channel for low energy neutrinos in SK, allowing the detector supernova pointing capability by reconstructing the direction of scattered electrons. SK is currently the largest and most sensitive SN neutrino detector in the world and it has an active real-time supernova neutrino burst monitor (Abe et al. 2016). In 2020, the water in the SK detector was loaded with gadolinium (Gd) to increase the project’s sensitivity to low energy electron anti-neutrinos ( ) by improving the identification of neutrons resulting from their most likely (about 85%) interaction in water: inverse beta decay (IBD).
But not only supernova bursts can provide alerts for supernova explosions. Prior to the collapse of their cores, very massive stars nearing the end of their lives are supported by the nuclear fusion of heavy nuclei. These are commonly known as pre-supernova stars; their main cooling mechanism is via neutrino emission. Pairs of neutrinos and anti-neutrinos of all flavors are produced during this phase (Odrzywolek et al. 2004), and the enhanced sensitivity to low energy  in SK-Gd allows the detection of neutrinos emitted during the terminal silicon (Si) burning period.
A potential world-first detection of pre-supernova neutrinos by SK-Gd would help to resolve open questions regarding stellar evolution models as well as provide valuable input regarding the longstanding issue of the neutrino mass hierarchy (Kato et al. 2020). These new detection capabilities have also motivated the creation of a pre-supernova alert system for the experiment. SK-Gd’s sensitivity to pre-supernova neutrinos and details of its new alert system are presented in this article.
2. The SK Experiment
The SK experiment is a 50 kiloton (kt) water Cherenkov detector located in the Kamioka mine in Japan (Fukuda et al. 2003). It was designed to study neutrinos with energies from a few megaelectronvolts to a few hundreds of gigaelectronvolts, produced by a variety of both natural and artificial sources. The detector consists of a cylindrical stainless steel tank with a 39.3 m diameter and a 41.4 m height, divided into an inner detector (ID) and an outer detector (OD). The ID is responsible for the event detection, with over 11,000 20 inch photomultiplier tubes (PMTs) and it has a volume of 32 kt, although the usual fiducial volume (FV) used in SK analyses is 22 5 kt. The OD has a thickness of about 2 m and it is composed of 1885 8 inch PMTs, facing the outside of the detector to reduce entering cosmic ray-induced backgrounds.
From 2020 July 14, SK officially started the SK-Gd phase, in which 13 tons of gadolinium sulfate octahydrate  were added to the water in the detector, achieving a concentration of 0.01% Gd by mass (Abe et al. 2022). Gadolinium sulfate octahydrate is an easily soluble compound and it has good transparency to the Cherenkov light. The SK-Gd project was first proposed as GADZOOKS! by (Beacom & Vagins 2004) to improve the identification of neutrons resulting from processes including IBD, the main interaction channel for low energy
  . IBD interactions have in their final state a prompt positron, which is directly detected through Cherenkov radiation, and a delayed neutron, which travels a short distance before being thermalized in water and then captured by nuclei. These nuclei de-excite by emitting γ-rays that are detected mainly due to Compton-scattered electrons producing Cherenkov light. Among all the naturally occurring elements, Gd has the largest thermal neutron cross-section capture, of approximately 49,000 barns.
The de-excitation γ-rays have different energies depending on the capture nuclei. A neutron capture on hydrogen emits a single 2.2 MeV γ-ray, which has low detection efficiency since its Compton electrons are close to or below the Cherenkov threshold; in pure water the neutron capture time constant is approximately 200 μs. With small amounts (≥0.01% by mass) of Gd dissolved in the water of the detector, the majority of thermal neutron captures will be on the Gd since it has a neutron capture cross section about 100,000 times larger than that of hydrogen. These captures on Gd emit easily detectable γ-ray cascades of about 8 MeV (Beacom & Vagins 2004). The current phase of SK-Gd corresponds to a loading of 0.01% Gd by mass and, as a consequence, approximately 50% of the neutron captures are on Gd. The presence of Gd shortens the neutron capture time constant, which for the present loading has been measured to be 115 ± 1 μs (Abe et al. 2022). In the next loading phase—planned to begin in mid-2022—the Gd concentration will be increased to 0.03% to yield ∼75% captures on Gd. The final goal is to have SK loaded with 0.1% Gd, which will result in approximately 90% of the captures being on Gd.
The search for IBD events is characterized by the coincidence between the prompt positrons and delayed neutrons. This signature is used to distinguish background events, since it is unlikely that uncorrelated events produce the same pattern. The efficient neutron identification provided by Gd brings benefits to different analyses in SK such as supernova neutrinos, proton decay and atmospheric neutrino studies, and in the search for signals from nuclear power reactors and the diffuse supernova neutrino background, which is the as-yet unobserved (Beacom & Vagins 2004; Beacom 2010) integrated neutrino flux from all core-collapse supernovae (CCSNe) throughout the history of the universe. Another possible first-time detection of SK-Gd would be the neutrinos coming from the silicon (Si) burning phase of stars preceding the CCSN, also known as pre-supernova neutrinos.
The EGADS (Evaluating Gadolinium’s Action on Detector Systems) detector has been used to simulate the Gd loading in SK (Marti et al. 2020). Also located in the Kamioka mine, EGADS was designed to be a smaller prototype of SK-Gd; it is a stainless steel tank with 200 tons of water and 240 PMTs installed on the walls, and uses the same electronics as SK. Among other important results, prior to the loading of Gd into SK’s water EGADS demonstrated the ability to maintain ultrapure water-style transparency in the presence of Gd, a viable method of safely removing the Gd from the detector when desired, and the additions to the existing SK water system needed in order to prepare for Gd loading. The EGADS detector is currently running with a concentration of 0.03% Gd by mass in order to validate operating conditions and techniques for the next planned SK-Gd phase.
3. Pre-supernova Neutrinos
Massive stars, which are stars with initial masses greater than 8 solar masses (M⊙) at the zero-age main sequence (ZAMS), often 59 end their lives in a CCSN. Prior to their cores collapsing—as massive stars burn most of their hydrogen into helium—the increasing density and temperature of their cores allow the fusion of heavier nuclei (Woosley et al. 1978). With the ignition of carbon burning, massive stars are classified as neutrino-cooled stars (Arnett 2020); in this phase the amount of neutrino emission from thermal and nuclear processes increases significantly, becoming the main cooling mechanism of these stars. A neutrino-cooled star lasts hundreds of years, reaching a neutrino luminosity of about 1012 solar luminosity (L⊙), while the photon luminosity is only 105 L⊙ at this stage (Odrzywolek et al. 2004).
When the neutrino-cooled stage begins, massive stars typically 60 proceed with nuclear fusion of helium (He), carbon (C), oxygen (O), neon (Ne), and silicon (Si). The burning of these elements starts from the core and then propagates toward the edges of the star in concentric shells (Woosley et al. 1978), due to differing densities and temperatures within the stellar volume. Closer to the onset of the gravitational collapse, the final structure of the neutrino-cooled star is an iron core surrounded by shells containing the products of the sequence of elemental nuclear burning phases. At this point, neutrino-cooled stars are commonly called pre-supernova stars.
Although many processes contribute to the neutrino emission from pre-supernova stars, at the very high temperatures at this stage the electron-positron annihilation process generating thermal neutrinos (Equation (1)) is the star’s dominant form of cooling:

where x = e, μ, and τ.
The Si-burning phase, which is expected to last for just a few days at temperatures of approximately 3 × 10⁹ K (Woosley et al. 1978; Odrzywolek et al. 2004), creates an iron core whose inability to generate energy via fusion into still heavier elements can then initiate the CCSN. The electron anti-neutrinos emitted at the Si-burning stage, which correspond to the 1/3 of the anti-neutrino flux (Odrzywolek et al. 2011), can exceed the energy threshold of IBD reactions, making their detection possible in SK-Gd. Figure 1 shows the expected number of IBD interactions in SK for different Betelgeuse-like pre-supernova models during the final 10 hr prior to core collapse for 15 M⊙ stars located 150 pc away from Earth.
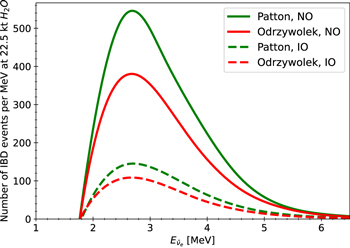
Figure 1. Number of pre-supernova IBD interactions in the 22.5 kt SK FV integrated over the last 10 hr prior to the CCSN as a function of the  . The Betelgeuse-like models consider stars with initial masses of 15 M⊙ located 150 pc away from Earth, for both normal neutrino mass ordering (NO) and inverted neutrino mass ordering (IO).
Download figure:
Standard image High-resolution imagePre-supernovae  have never been observed before; their detection would not only provide unique, unperturbed information detailing otherwise hidden stellar interiors, but also contribute evidence regarding which neutrino mass hierarchy is the correct one (Guo et al. 2019; Kato et al. 2020). Being able to detect them also opens the possibility of creating a pre-supernova alarm for SK, potentially delivering alerts hours before the arrival of any other CCSN signals since the emission of pre-supernova neutrinos takes place over a very long timescale compared to the subsequent supernova burst neutrinos upon which most supernova alarms are based.
3.1. Pre-supernova Models
In addition to pair annihilation  for the cooling of massive stars, beta processes are expected to also contribute significantly at the pre-supernova stage, with an average more energetic
  flux (Patton et al. 2017). Due to the large interaction cross section for IBD at both the typical pair annihilation and beta process energies, only electron anti-neutrinos from the silicon burning phase are expected to be detected in SK (Odrzywolek et al. 2004).
Following previous analyses (Simpson et al. 2019), in order to perform estimations of the expected signal from pre-supernova neutrinos in SK, two models for the thermodynamics of stellar evolution were used: (Odrzywolek & Heger 2010) and Patton et al. (2017). Both models provide online data sets for the calculation of anti-neutrino emission during the pre-supernova stage. The first, earlier model from (Odrzywolek & Heger 2010) assumes that the entire neutrino flux comes from pair annihilation. For the nuclear isotopic composition of the star, this model assumes a nuclear statistical equilibrium, which is a treatment only dependent on the temperature, density, and electron fraction, making a flux estimate by post-processing an already existing stellar model. The second model (Patton et al. 2017) includes a more complete evaluation of the neutrino flux from the pre-supernova stars, considering the contribution of individual isotopes to the stellar evolution, which affects the neutrino emission rate from weak nuclear processes. The model also includes contributions not only from pair annihilation, but also from other thermal and nuclear processes such as plasmon decay, photoneutrino process, β-decay, and electron capture.
For signal estimations, the flavor oscillations of electron anti-neutrinos as they travel through the stellar volumes were taken into account. The description of oscillations in matter is called the Mikheyev–Smirnov–Wolfenstein (MSW) effect (Smirnov 2005). The ratio by which the flux of electron anti-neutrinos is changed depends on the electron number density of the star and the neutrino mass ordering (as yet unknown), which changes the mixing parameters. Different transition probabilities are assumed for normal and inverted neutrino mass ordering to account for this change in the ratio of electron flavor neutrinos due to the dense stellar medium in addition to the effects of oscillations in vacuum.
4. Analysis Strategy
The detection of low energy electron anti-neutrinos from pre-supernova stars in SK is mainly through the IBD interaction, where the products are a prompt positron and a delayed neutron. Searches for IBD events consider the coincidence of the products of the interaction.
Previous analysis (Simpson et al. 2019) of the sensitivity of SK to pre-supernova stars considered the detection of two different detection channels; in addition to the search for prompt and delayed parts, the search for just the delayed neutrons individually was also used to calculate the expected sensitivity. For this analysis, however, only coincidence events are considered since, due to the higher rate of single neutron events, the further development of an online alert system would be negatively affected by a significant increase of the processing time. For this reason, techniques were developed to optimize the online selection of only coincidence events, while the single neutron events will be utilized in a planned future improvement of the alert system to post-check data in case of potential alerts.
4.1. Event Simulation
In order to simulate the IBD events, and following what was done in Simpson et al. (2019), two different γ-ray emission models from neutron capture on Gd are used: the generic liquid scintillator simulator GLG4sim (GLG4SIM 2006), and a second model created by a group at Okayama University using data from the Accurate Neutron-Nucleus Reaction Measurement Instrument (ANNRI) spectrometer at the Japan Proton Accelerator Research Complex (J-PARC). The ANNRI model was based on measurements of γ-ray properties with an array of germanium detectors at the facility (Ou et al. 2014). The GLG4sim model uses GEANT4 (Agostinelli et al. 2003) support for neutron capture on Gd, but also includes spectral information regarding high energy γ-rays, which the original GEANT4 does not consider (GLG4SIM 2006). The ANNRI model uses GEANT4 Monte Carlo simulation and the spectrometer data to describe the γ-ray spectrum from neutron captures on Gd (Hagiwara et al. 2019). The models assume an isotropic distribution for the angles of γ-ray emission. Both are included in this analysis to provide systematic uncertainties for the pre-supernova neutrino sensitivity results in SK.
To reproduce IBD coincidence events, simulation of prompt positrons and delayed neutrons were performed and put in coincidence in time and distance to each other. The SK Monte Carlo software was employed to simulate positron events and γ-ray events from the neutron captured on Gd, using the GLG4sim and ANNRI models. These coincidence events were simulated in different positions of the ID, with positron energies ranging between 0.8 and 7.0 MeV. Figure 2 shows the signal efficiency as a function of positron true energy for the simulations using both γ-ray models for the event selection that will be described in Sections 4.3 and 4.4.
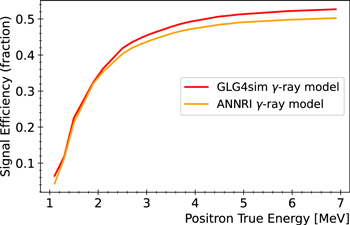
Figure 2. Selection efficiency vs. positron true energy for SK with 0.01% Gd for the two γ-ray models used for analysis GLG4sim (GLG4SIM 2006) and ANNRI (Ou et al. 2014).
Download figure:
Standard image High-resolution image4.2. Backgrounds
The sensitivity to pre-supernova neutrinos at SK with 0.01% Gd was evaluated using Monte Carlo and SK data prior to the first Gd loading to calculate the contributions from different background sources, which later were compared to SK-Gd data. The main backgrounds are:
- 1.Reactor and geo electron anti-neutrinos in the same energy region as pre-supernova neutrinos. These are true, irreducible physics backgrounds.
- 2.Trace amounts of radioactive isotopes mixed in along with the Gd. After being distributed in the detector these radioactive impurities could contribute to backgrounds from (α, n) and spontaneous fission processes.
- 3.Accidental coincidences, which are intrinsic detector backgrounds due to radioactive decays from the detector materials, PMT dark noise, and uncorrelated events that randomly occur close in time and distance. These backgrounds were evaluated by processing around 7000 hr of data from different SK data periods.
- 4.Spallation, due to cosmic rays muons. Most of these low energy decays of unstable nuclei can be eliminated as they are correlated in time and space with energetic muons.
The main background sources for pre-supernova neutrinos are the reactor neutrinos, primarily a result of the activity of Japanese nuclear power reactors, and geoneutrinos, which come from the decay of natural radioisotopes inside the Earth. These are irreducible backgrounds, in the same energy range as pre-supernova neutrinos. The web page geoneutrinos.org has an application to evaluate reactor and geoneutrino fluxes, giving the rate and energy spectrum of anti-neutrino interactions at any location on the planet (Dye & Barna 2021). The application uses the IAEA’s database Power Reactor Information System (IAEA 1989) to account for each reactor’s activity during specific periods. To give the best possible estimations of the current reactor and geoneutrino backgrounds, when applying this tool to the pre-supernova alarm the most up-to-date information from geoneutrinos.org is used and further corrected with the most recently updated information regarding reactor activity in Japan.
Backgrounds due to radioactive contamination of the Gd loading come mainly from 18O(α,n)21Ne* and 17O(α,n)20Ne* processes, mainly a consequence of contamination with 235U series isotopes that are α emitters. The decay of neon isotopes results in pairs of neutrons and the signal of one of the neutrons can be mistaken for a positron, thereby becoming a background for coincidence IBD events. Since the spontaneous fission of 238U also produces one or more neutrons per fission, this also can contribute to the overall background level.
Muons from cosmic rays create unstable daughter nuclei through spallation, which can in turn produce β-delayed neutrons (neutrons associated with the beta decay of the fission products). In particular, β-ray energy for the decay of nitrogen-17 is in the energy range of interest for this analysis.
Initially, all of the described backgrounds were evaluated with Monte Carlo, apart from the accidental coincidences background which was calculated from data. When SK-Gd data became available, these backgrounds were more rigorously quantified after processing 2000 hr of data. After the event selection, described in Section 4.4, the remaining background rate is taken into account to calculate the sensitivity to pre-supernova neutrinos in SK.
4.3. Trigger Considerations
The pre-supernova alert system is integrated into an independent trigger in SK called the Wide-band Intelligent Trigger (WIT; Carminati 2015; Elnimr 2017). WIT is a system designed to extend the sensitivity of SK to lower energy events using parallel computing to reconstruct vertices in real time, discarding events that are not well reconstructed or very close to the walls of the detector. The WIT system consists of more than 400 hyper-threaded cores spread over 10 online computers that work in parallel with each other. The system will be significantly upgraded during 2022 with a batch of new computers containing hundreds of additional cores.
The WIT system receives raw data blocks containing about 23 ms of data each from data acquisition machines; these blocks are then distributed to the 10 online computers to search for signals (11 PMT hits within 230 ns) above expected dark noise levels (12 hits) inside these blocks.
The hits passing this procedure proceed to another filter called STORE (Software Triggered Online Reconstruction of Events). STORE looks for PMT hits originating from a single vertex by considering the Cherenkov emission of low energy electrons a point source, a reasonable assumption since these electrons can only travel a few centimeters in water (Carminati 2015), which is much smaller than SK’s vertex resolution. STORE selects the largest set of hits that are consistent with being from a point source. Another trigger condition applied requires that for any two PMT hits the time difference between them must be less than or equal to the time required to travel between them at the speed of light in water. From these selected hits, STORE gathers four-hit combinations, using their arrival times to calculate vertex position, in which the time residuals ((time of the PMT hit) - (time of flight) - (time of the test vertex)) of the four hits must be zero.
The selected hits from STORE go through a fast vertex reconstruction called ClusFit, which eliminates isolated hits to reduce the effects of reflected and scattered light and dark noise (Carminati 2015). The fast online vertex reconstruction in WIT is concluded by applying BONSAI (Branch Optimization Navigating Successive Annealing Iterations) (Smy 2007) to the selected events from Clusfit that are at least 1.5 m away from any PMT.
BONSAI uses events within 500 ns before and 1000 ns after the trigger time, performing a maximum likelihood fit to all arrival times of PMT hits inside this window, testing for each one a vertex hypothesis and choosing the ones with maximized likelihood as the reconstructed vertices. BONSAI saves the 1500 ns events that are inside the FV (2 m away from the inner PMT wall) and that have at least 10 hits with time residuals within −6 and +12 ns (Locke et al. 2020).
The reconstructed events are sent to WIT’s organizer machine, which is a computer responsible for sorting the events in time, gathering about 90 s worth of data into one file. The sorted events are then transferred to the offline computers for further processing by the various offline SK physics analyses.
4.4. Event Selection
To select the IBD pre-supernova events, multivariate methods are used, in particular Boosted Decision Tree (BDT) (Coadou 2013), which is applied at two different levels of the data processing for reasons of both speed and efficiency. While one of the BDTs is used as the final selection of pre-supernova events, the other BDT, called BDTonline, is applied to search for IBD candidate events in the WIT data.
The initial search for IBD pair candidates is performed using the number of hit PMTs and the reconstructed position and time of events. This information is available online when data is being saved by the WIT trigger, looping over all events passing the fast online reconstruction. For each prompt event candidate, a delayed candidate event is searched in a time window from −17 to 290 μs relative to the prompt candidate (each hardware trigger is 17 μs long). If the delayed candidate has a minimum number of hit PMTs, the time between the prompt and delayed candidates, dT, as well as the distance between their reconstructed positions, dR, are calculated.
As described in Section 2, IBD events are very well characterized by the spatial and timing coincidences between the prompt and delayed signals, represented by the variables dR (distance) and dT (time). When comparing accidental coincidences with signals, these variables have very different distributions. However, a selection using only this information is not enough to sufficiently reduce backgrounds. For that reason, BDTs were implemented in the analysis.
BDTonline, applied during the initial search for signal events, was trained based only on the variables available online from fast WIT online vertex reconstruction; BDTonline is used at this early real-time processing stage as a preselection of potential IBD candidates. The final selection of events is done by applying cuts in dR, dT, and to a score resulting from another BDT classifier, which is based on the angular distribution of hits, reconstructed energy, and quality, and distance from events to the detector wall. Figure 3 shows the signal and background separation for both BDTs. Both BDTs are trained using random subsets of SK-Gd data as background and a portion (about 30%) of the generated IBD coincidence events using the GLG4sim model, as described in Section 4.1, as a signal.
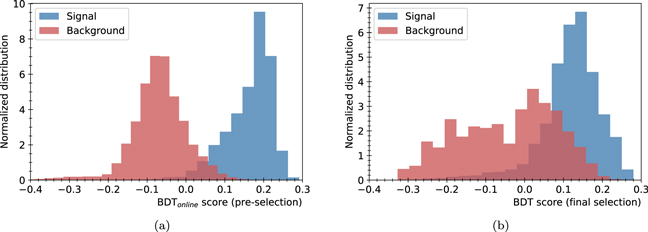
Figure 3. Signal-background separation for the two Boosted Decision Tree classifiers used for (a) preselection (BDTonline) and (b) final selection.
Download figure:
Standard image High-resolution imageUsing two BDTs in the selection process is justified by the need for having fast processing time in the alert system, since it is an online system that constantly and uninterruptedly processes many data sets, running statistical evaluations to make alarm decisions and send alerts. For this reason, the system needs to process data as quickly as possible, but without losing detection efficiency. BDTonline improved the speed of the alert system by filtering pair candidates more efficiently, reducing the number of background events being carried through the full data reduction. The combination of the two BDTs ultimately resulted in better sensitivity to pre-supernova neutrinos than using only one of them.
Analyzing 2000 hr of SK-Gd data, optimizations to the selection were performed and the backgrounds’ contributions were re-evaluated in order to quantify the contributions from the different sources and better predict the sensitivities of the current and future SK-Gd loading phases. These results are described in the next section.
5. Sensitivity to Pre-supernova Neutrinos
Previous sensitivity results for the detection of pre-supernova neutrinos in SK with 0.1% Gd were given in Simpson et al. (2019). However, the first—and current, as of this writing—phase of SK-Gd has a concentration of 0.01% Gd, and the development of the pre-supernova alert system required a dedicated response model for the current phase. In this section, the estimated sensitivity to pre-supernova neutrinos is presented. General details about the alert system, its expected early warning times, and its coverage of our galaxy are covered in Section 6.
Some important statistical parameters such as signal and background time windows, hypothesis tests, and false-positive rates (FPRs) need to be taken into account to estimate the sensitivities. The statistical evaluation that is performed by the alert system is also used to provide early warnings and estimate the range of detection of pre-supernova stars. These evaluations are performed as Poissonian counting experiments (Lista 2015). For counting experiments, the p-value is the probability of counting a total number of events greater than or equal to the expected number in which only background and no signal is present. One way to calculate the p-value of the total number of selected events inside a predefined time window Nevents, for an expected number of background events NBG is
where Pois(n; NBG) is the Poisson distribution of the variable n with average NBG.
α-Ori (Betelgeuse in the constellation Orion) is currently the best candidate for detecting pre-supernova neutrinos. Cuts and statistical parameters were optimized to give the longest early warnings possible for Betelgeuse. Even in the best current estimations, its mass and distance from the Earth remain somewhat uncertain but are highly correlated; consequently, results are given in combinations to match what is commonly found in the literature and the available pre-supernova models: 150 pc for 15 M⊙ and 220 pc for 25M⊙ (Dolan et al. 2016; Harper et al. 2017; Joyce et al. 2020). The signal window chosen to perform statistical evaluations was based on which choice would maximize the warning time for Betelgeuse-like models—the earliest alerts would be sent for a potential CCSN of Betelgeuse. Figure 4 shows the warning time for Betelgeuse-like models in the last 70 hr before CCSN as a function of the signal time window used for statistical evaluations. A signal window in the interval from 7–13 hr would be one in which all Betelgeuse-like models have their longest early warnings. A window near the lower end of this range, 8 hr, but comfortably removed from the steep falloff in warning times seen with shorter windows, was chosen to maximize the early warning time while simultaneously minimizing potential negative impacts of the pre-supernova alarm inducing long interruptions in the usual data acquisition or planned calibration work in the SK detector.
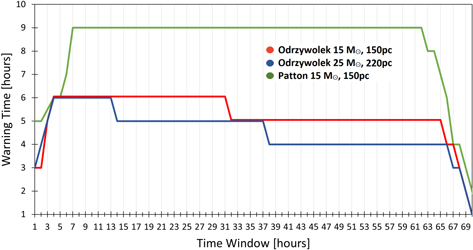
Figure 4. Expected warning times for Betelgeuse-like models evaluated as a function of the chosen time window to perform statistical evaluations in hourly steps. The estimations consider the neutrino flux from the last 70 hr before core collapse for stars with 15M⊙ at 150 pc and 25M⊙ at 220 pc following the model (Odrzywolek & Heger 2010), and 15M⊙ stars at 150 pc following (Patton et al. 2017). Normal neutrino mass hierarchy is assumed.
Download figure:
Standard image High-resolution image5.1. Results for SK’s First Gd Loading
The following results are dependent on the neutrino mass ordering, ZAMS mass of the star, distance to the star, and star evolution model. The models for neutron capture on Gd being used are the γ-ray models GLG4sim and ANNRI, employed to give systematic uncertainties to the results.
With the implementation of BDTonline, sensitivity estimations were improved and faster data processing was achieved, as fewer events had to be carried through the reduction after the initial search for pair candidates. Other optimization cuts to the variables used for final selection were also performed in order to maximize potential early warnings. The optimized cuts used for final selection are coincidence distance dR < 300 cm, coincidence time dT < 150 μs, and  , resulting in an irreducible background rate of approximately 0.1 events/hour.
61
Figure 5 shows some key distributions before and after the selection for the full samples of 2000 hr of SK-Gd data and IBD-generated events using the GLG4sim model. The selection with BDTs also removed any visible bursts in data, which were presumably from spallation.
, resulting in an irreducible background rate of approximately 0.1 events/hour.
61
Figure 5 shows some key distributions before and after the selection for the full samples of 2000 hr of SK-Gd data and IBD-generated events using the GLG4sim model. The selection with BDTs also removed any visible bursts in data, which were presumably from spallation.
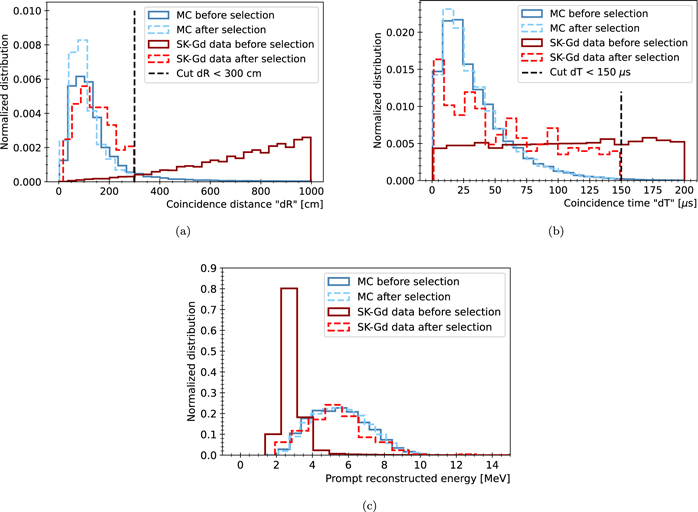
Figure 5. Comparison of SK-Gd data and simulation for coincidence distribution variables (a) distance dR, (b) time dT, and (c) prompt reconstructed energy. Dark colors represent the variables before the final selection and light colors after the selection. Histograms are normalized to area = 1.
Download figure:
Standard image High-resolution imageBetelgeuse is the tenth brightest star in the sky. It is only about 8 million years old, but had a very quick evolution and is believed to now be close to becoming a CCSN. Table 1 shows the expected number of IBD events for Betelgeuse in SK with 0.01% Gd, following estimations of its mass and distance in the literature. Since the γ-ray emission models, GLG4sim and ANNRI, yield very similar results, the model GLG4sim was chosen as the baseline model for all subsequent analyses.
Table 1. Number of Expected IBD Events for Betelgeuse in SK with 0.01% Gd in the Final 8 hr Before Becoming a CCSN
| Betelgeuse-like | Neutrino Mass Hierarchy | |
|---|---|---|
| Model | Normal Ordering | Inverted Ordering |
| 15 M⊙, 150 pc | ||
| Odrzywolek | 30.9–31.5 | 8.8–8.9 |
| Patton | 41.9–42.7 | 12.5–12.7 |
| 25 M⊙, 220 pc | ||
| Odrzywolek | 25.0–25.5 | 7.1–7.2 |
Note. Results are shown for two different γ-ray emission models.
Download table as: ASCIITypeset image
Figure 6 shows the evolution of the expected number of IBD events in SK-Gd with 0.01% Gd after cuts for different pre-supernova models for stars at 200 pc for both normal and inverted neutrino mass hierarchies. As expected, the event rates increase significantly closer to the explosion. Figure 7 shows the evolution of detection significance of these pre-supernova models at 200 pc in the hours leading up to the CCSN.
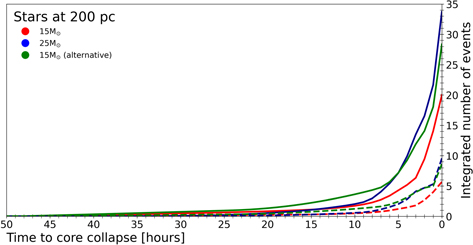
Figure 6. Integrated number of IBD events in SK with 0.01% Gd as a massive star (d = 200 pc) approaches core collapse. Solid lines show normal neutrino mass hierarchy and dashed lines show inverted neutrino mass hierarchy. The considered fluxes are evaluated for stars with 15 and 25 M⊙ following the model by Odrzywolek & Heger (2010), and also alternatively for 15 M⊙ stars following Patton et al. (2017).
Download figure:
Standard image High-resolution image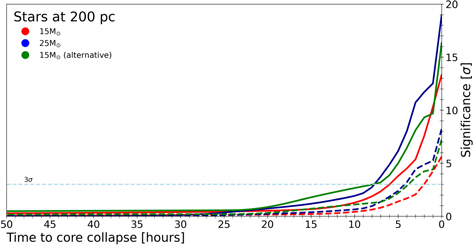
Figure 7. Evolution of the significance level in SK with 0.01% Gd over the last 50 hr before the core collapse for massive stars at d = 200 pc. Solid lines show normal neutrino mass hierarchy and dashed lines show inverted neutrino mass hierarchy. The considered fluxes are evaluated for stars with 15 and 25 M⊙ following the model of Odrzywolek & Heger (2010), and also alternatively for 15 M⊙ stars following Patton et al. (2017).
Download figure:
Standard image High-resolution imageFigure 8 shows the number of IBD events expected in SK-Gd with 0.01% Gd as a function of the distance to the star integrated over the last eight hours preceding the CCSN. Background rates are also shown. These results indicate that SK with 0.01% Gd can observe pre-supernova neutrinos with a 3σ detection significance for stars up to 600 pc away from Earth.
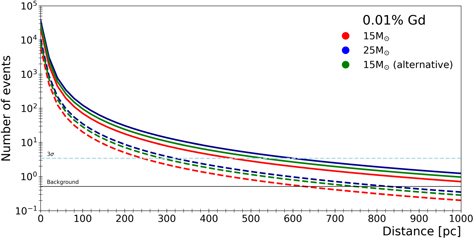
Figure 8. Expected number of IBD events in SK with 0.01% Gd as a function of distance. Solid lines show normal neutrino mass hierarchy and dashed lines show inverted neutrino mass hierarchy. The considered fluxes are integrated over the eight hours preceding the core collapse, for stars with 15 and 25 M⊙ following the model by Odrzywolek & Heger (2010), and also alternatively for 15 M⊙ stars following Patton et al. (2017).
Download figure:
Standard image High-resolution imageThese results demonstrate the possibility of detecting pre-supernova neutrinos even in the first phase of SK-Gd, and also suggest the viability of creating a pre-supernova alarm based on their detection. Discussions about the development of such a pre-supernova alert system will be presented in Section 6. Subsequent phases of SK-Gd will have greater Gd concentrations, and predictions for their pre-supernova sensitivities will be shown next.
5.2. Future SK-Gd Loading Phases
After characterizing backgrounds with the current SK-Gd data, evaluations of sensitivities for future Gd loading concentrations were performed. The next proposed phase is for a concentration of 0.03% Gd, while the final phase will have a concentration of 0.10% Gd. Since 2020 November, the 200-ton EGADS detector has been loaded with 0.03% Gd and taking data; all has gone well, verifying the feasibility of the next SK-Gd phase planned to begin in mid-2022. With higher concentrations of Gd in the SK water, neutrons will be observed with increasing efficiency, which will enhance the experiment’s pre-supernova neutrino detection capabilities.
Figure 9 shows the number of IBD events expected in SK integrated over the last eight hours preceding a CCSN as a function of the distance to the star for the future phases of SK-Gd. Estimated increases in the background rates are also shown.
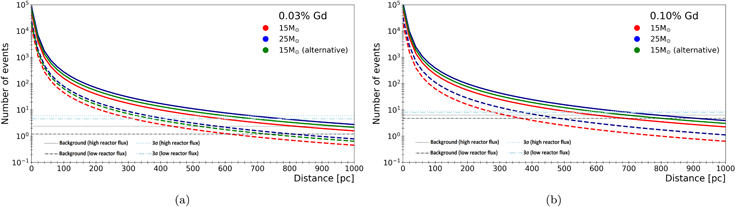
Figure 9. Expected number of IBD events in SK with (a) 0.03% Gd and (b) 0.10% Gd as a function of distance. Solid lines show normal neutrino mass hierarchy and dashed lines show inverted neutrino mass hierarchy. Results are shown considering two reactor scenarios: with low reactor flux (all Japanese reactors turned off), and high reactor flux (double the current contribution). The considered fluxes are integrated over the eight hours preceding the core collapse, for stars with 15 and 25 M⊙ following the model by Odrzywolek & Heger (2010), and also alternatively for 15 M⊙ stars following Patton et al. (2017).
Download figure:
Standard image High-resolution imageBackgrounds to the pre-supernova IBD signal will naturally increase as the Gd concentration is raised, since doing so will also mean higher efficiencies for detecting the IBD reactions arising from reactor and geoneutrinos, which are the main physics backgrounds to pre-supernova neutrinos. In addition, further dissolving of Gd salts in the detector will mean greater overall radioactive contamination, increasing the rate of backgrounds from (α, n) and spontaneous fission processes. Due to the uncertain future of nuclear power in Japan, backgrounds are considered for two scenarios: with low reactor fluxes, in which all Japanese reactors are off, and with high reactor fluxes, meaning double the current reactor contributions. These preliminary results show that, in optimistic scenarios, for SK-Gd with 0.03% the pre-supernova neutrinos can be detected from stars up to about 700 pc away, and for 0.10% Gd the detection radius will be over 700 pc. As will be discussed later, future Gd loading phases should also enable earlier warnings from the alert system.
Other current and near-future neutrino experiments such as SNO+ (Albanese et al. 2021) and JUNO (JUNO Collaboration 2022) expect to have the ability to detect pre-supernova neutrino signals, while future dark matter direct detection experiments could detect all flavors of pre-supernova neutrinos via coherent neutrino-nucleus scattering (Raj et al. 2020). KamLAND has an active pre-supernova alarm and comparisons with SK-Gd are shown next.
5.3. Comparison to KamLAND
The KamLAND experiment—also located in the Kamioka mine—has a working pre-supernova alert system with expected sensitivities comparable to SK-Gd. KamLAND is a liquid scintillator detector, with lower energy thresholds than SK and lower background rates. The pre-supernova alert system in KamLAND works with a set background rate of between 0.071 and 0.355 events day−1, depending on the reactor activity in Japan, and integrates selected events over a 48 hr time window every 15 minutes (Asakura et al. 2016). KamLAND can be expected to see many fewer pre-supernova events than SK, however, since KamLAND’s FV is less than 5% that of SK.
Based on the results reported in Asakura et al. (2016), the relative sensitivity to pre-supernova neutrinos of the current SK-Gd phase and KamLAND is shown in Figure 10. Figure 11 shows the same comparison for future SK-Gd phases.
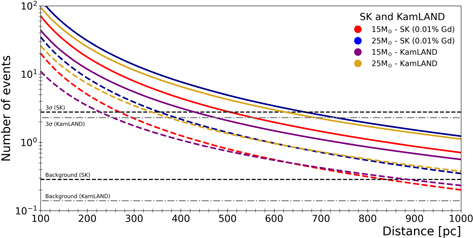
Figure 10. Expected number of IBD events in SK with 0.01% Gd and for KamLAND as a function of distance. All Japanese reactors are assumed to be off. Solid lines show normal neutrino mass hierarchy and dashed lines show inverted neutrino mass hierarchy. The considered fluxes are integrated over eight hours preceding the core collapse for SK-Gd and 48 hr for KamLAND, for stars with 15 and 25 M⊙ following the model by Odrzywolek & Heger (2010).
Download figure:
Standard image High-resolution image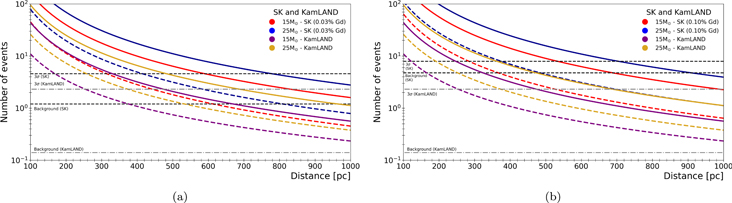
Figure 11. Expected number of IBD events in KamLAND and in SK with (a) 0.03% Gd and (b) 0.10% Gd as a function of distance. All Japanese reactors are assumed to be off. Solid lines show normal neutrino mass hierarchy and dashed lines show inverted neutrino mass hierarchy. The considered fluxes are integrated over eight hours preceding the core collapse for SK-Gd and 48 hr for KamLAND, for stars with 15 and 25 M⊙ following the model by Odrzywolek & Heger (2010).
Download figure:
Standard image High-resolution imageCombining the results of both detectors could lead to extended detection ranges and earlier warnings for a joint alarm; discussions between the Collaborations have been initiated with this goal in mind.
6. Online Search for Pre-supernova Neutrino Signal
SK’s pre-supernova alert system is intended to provide early warning of an incipient nearby supernova based on the detection of pre-supernova neutrinos. It became operational—analyzing real-time data and ready to send out alarms of potential CCSNe—on 2021 October 22.
The alarm software is installed in the WIT online computer cluster, performing its pre-supernova neutrino search right after the fast online vertex reconstruction, as described in Section 4.3, is completed. The alarm has its own organizing processes which utilize (1) information from the hardware trigger, a real-time counter used to group together acquired data in time, and (2) reconstructed time of events. This allows the alarm software to calculate the absolute time of events and sort them in time.
To avoid false alerts, a volume cut is applied around calibration sources deployed inside the detector. Also, when calibration work is actively being performed in SK the system automatically ignores the data from that period by not processing any new data until the work is finished. False alerts from a statistical point of view will be discussed later in Section 6.2.
6.1. Data Flow
The alert system works with default values of background rate and signal time window, which are parameters used for statistical evaluation. As background levels are periodically updated, it is possible to change the input values of these parameters in the system.
When active, the system checks all the available data from the WIT trigger, creating a to-do queue, which includes data that have not been processed yet. All data in the queue go through reduction, which starts with the search for IBD pair candidates. This is followed by a preselection of the pairs, which includes BDTonline. Then a final selection takes place using coincidence distance dR, coincidence time dT, and a BDT based on angular distribution of hits, reconstructed energy, and quality, and distance from events to the detector wall, as explained in Section 4.4. When the queue is empty, the system will look again for new data to create a new to-do queue.
All of the IBD pair candidates have their information saved: the absolute time of events, coincidence time, distance between prompt and delayed parts of the IBD event, and reconstructed vertices. This information is also used to graphically follow trends in the time evolution of candidate events and significance of detection, as well as the distribution of these events inside the SK detector.
A rough estimation for the latency time of the alert system, which is the interval between the time when an event actually occurs, is processed through WIT, and the alert system makes an alarm decision, is summarized in Table 2 based on tests performed on the system. Since they occur sequentially, the times in this table must be added together to arrive at the total latency, which is currently about 11 minutes. As mentioned previously, the WIT system is now being upgraded with new machines; this is expected to reduce the overall latency time to well below 10 minutes.
Table 2. Estimated Latency Time of Each Step in the Pre-supernova Alert System
| Process | Estimated Time |
|---|---|
| Data fitting (WIT system) | 4 minutes |
| Process queue ( ∼2 × 10⁶ events) | 5 minutes |
| Alarm decision/export results | 2 minutes |
Note. Total latency time is the sum of the latency of each step.
Download table as: ASCIITypeset image
Every time a new subset of data is processed, the system calls a function to perform the statistical evaluation, which counts the number of events that were selected inside the signal time window in order to make an alarm decision. If the decision is positive, the system sends alerts regarding the possibility of a supernova.
The SK detector is monitored constantly by collaborators. The status of the pre-supernova alert system is included in the SK monitoring via a web page that displays real-time information from the system. In addition to technical status-related data, the web page includes the latest results from (and history of) the alert system’s statistical evaluations. These graphs of the recent IBD pair candidate rate and evolution of the resulting significance level can be used to monitor unusual fluctuations, in particular sudden increments in IBD pair candidates and detection significance which can lead to potential alerts.
6.2. Alarm Decision
The alarm decision determines whether the software should send an alert or not. Many factors have to be taken into account, such as the current status of the detector, background rate levels, and FPRs.
After processing new data, the running number of selected IBD events undergoes a statistical evaluation to determine the significance of the detection, calculated with Poisson statistics as discussed in Section 5. When testing a hypothesis, one possible outcome is a false positive, which is the probability of believing a condition exists when it does not.
The choice of an acceptable FPR is often related to an experiment’s sensitivity, since requiring greater confidence in a result in order to reduce the FPR means less chance of positively identifying more marginal, but nevertheless real, signals. Consequently, a decrease in the FPR implies an increase in the experiment’s false-negative rate (FNR), and vice versa.
In order to have a real-world basis for the pre-supernova alert system’s chosen FPR, it was decided that the rate of CCSN explosions in our galaxy should serve as the maximum FPR. In other words, statistically speaking the system should not issue false alerts more frequently than Milky Way (MW) core-collapse explosions are expected to take place. Of course, the true rate of detectable pre-supernova explosions will be considerably lower than this since they must be located much closer to Earth than the average MW explosion, but the trade-off between FPR and FNR means that allowing the occasional false positive will improve sensitivity to the true positives.
From Adams et al. (2013) the rate of galactic CCSN explosions is taken to be  per century. This rate is derived using all supernova events observed over the last millennium with various corrections applied. The most important correction is due to what fraction of the galaxy is visible to the naked eye, since all recorded explosions inside the MW were observed before the invention of the telescope.
To introduce this factor, inside the signal window of eight chosen to perform statistical evaluations a cutoff is applied to the p-value:  8 hr−1 ∼ 7.4 × 10⁻⁵, requiring the alarm to send alerts in case the number of IBD events inside the signal window is enough to give significance levels above ∼ 4σ. However, if the significance level exceeds 3σ then a preliminary alert is sent to SK experts so they may begin monitoring the situation as it develops.
6.3. Alert System Sensitivity
The expected warning time as a function of distance for a 3σ detection by SK-Gd with 0.01% Gd is shown in Figure 12. In the most optimistic scenario, in which Betelgeuse’s true mass is 15 M⊙ at a distance of 150 pc and with normal neutrino mass hierarchy, following the model by Patton et al. (2017) the alert would be about 9 hr before the CCSN. Table 3 lists a number of nearby stars at different distances that could potentially provide observable pre-supernova neutrino signals.
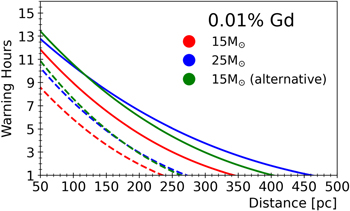
Figure 12. Expected warning time as a function of distance for a 3σ detection by the pre-supernova alert system for SK with 0.01% Gd. Solid lines show normal neutrino mass hierarchy and dashed lines show inverted neutrino mass hierarchy. The considered fluxes are evaluated for stars with 15 and 25 M⊙ following the model by Odrzywolek & Heger (2010), and also alternatively for 15 M⊙ stars following Patton et al. (2017).
Download figure:
Standard image High-resolution imageTable 3. List of Likely Pre-supernova Candidates with Estimated Masses and Distances
| Catalog Name | Common Name | Constellation | Distance | Mass |
|---|---|---|---|---|
| (kpc) | (M⊙) | |||
| HD 116658 | Spica/α Virginis | Virgo | 0.0766 ± 0.0041 a |
 b
b
|
| HD 149757 | ζ Ophiuchi | Ophiuchus | 0.107 ± 0.004 c |
 d
d
|
| HD 129056 | α Lupi | Lupus | 0.143 ± 0.003 a |
 a
a
|
| HD 78647 | λ Velorum | Vela | 0.167 ± 0.003 a |
 a
a
|
| HD 148478 | Antares/α Scorpii | Scorpius | 0.169 ± 0.030 a | 11.0–14.3 a |
| HD 39801 | Betelgeuse/α Orionis | Orion |
 e
e
| 16.5–19 e |
| HD 206778 |
| Pegasus | 0.211 ± 0.006 a |
 a
a
|
| HD 89388 | q Car/V337 Car | Carina | 0.230 ± 0.020 a | 9.0 ± 1.6 f |
| HD 34085 | Rigel/β Orion | Orion |
 g
g
|
 a
a
|
| HD 210745 | ζ Cephei | Cepheus | 0.256 ± 0.006 a |
 a
a
|
| HD 200905 | xi Cygni | Cygnus | 0.278 ± 0.029 a | 8.0 a |
| HD 47839 | S Monocerotis A | Monoceros | 0.282 ± 0.040 a | 29.1 a |
| HD 47839 | S Monocerotis B | Monoceros | 0.282 ± 0.040 a | 21.3 a |
| HD 93070 | w Car/V520 Car | Carina | 0.294 ± 0.023 a |
 a
a
|
| HD 68553 | NS Puppis | Puppis | 0.321 ± 0.032 a | 9.7 a |
| HD 36389 | CE Tauri/119 Tauri | Taurus | 0.326 ± 0.070 a |
 a
a
|
| HD 68273 | 2 Velorum | Vela | 0.379 ± 0.004 h |
 a
a
|
| HD 50877 | ø1 Canis Majoris | Canis Major | 0.394 ± 0.052 a |
 a
a
|
| HD 52877 | σ Canis Majoris | Canis Major | 0.513 ± 0.108 a |
 a
a
|
| HD 208816 | VV Cephei | Cepheus | 0.599 ± 0.083 a |
 a
a
|
| HD 203338 | V381 Cephei | Cepheus | 0.631 ± 0.086 a | 12.0 a |
| HD 17958 | HR 861 | Cassiopeia | 0.639 ± 0.039 a |
 a
a
|
| HD 80108 | HR 3692 | Vela | 0.650 ± 0.061 a |
 a
a
|
Notes.
a Mukhopadhyay et al. (2020, and references therein). b Nieva & Przybilla (2012). c Renzo and Götberg (2021). d Marcolino et al. (2009). e Joyce et al. (2020). f Kallinger et al. (2019). g Chesneau et al. (2014). h Rate et al. (2020).Download table as: ASCIITypeset image
6.3.1. Sensitivity for Future SK-Gd Phases
The expected early warning times for future SK-Gd phases were also evaluated after characterizing backgrounds using SK-Gd data. Although—as previously discussed—the background rates will be higher during the future phases, the expected sensitivity will also increase. Figure 13 shows the expected warning times at which the system would send alerts as a function of distance for a 3σ detection for SK with 0.03% and 0.10% Gd.
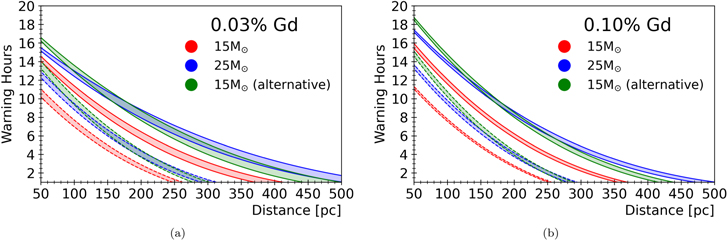
Figure 13. Expected warning time as a function of distance for a 3σ detection by the pre-supernova alert system for SK with (a) 0.03% Gd and (b) 0.10% Gd. The edges of the bands show two background scenarios considering low reactor flux (all Japanese reactors off) and high reactor flux (double the current contribution). Solid lines show normal neutrino mass hierarchy and dashed lines show inverted neutrino mass hierarchy. The considered fluxes are evaluated for stars with 15 and 25 M⊙ following the model by Odrzywolek & Heger (2010), and also alternatively for 15 M⊙ stars following Patton et al. (2017).
Download figure:
Standard image High-resolution imageDuring future phases of SK-Gd and for the same optimistic scenario discussed above, Betelgeuse would have early warning alerts about 10–12 hr in advance of its end as a CCSN.
7. Conclusion
SK is a neutrino observatory in operation since 1996 that has recently entered its SK-Gd phase; Gd was loaded into the detector in 2020, achieving a concentration of 0.01% Gd. This phase is characterized by increased sensitivity to thermal neutrons due to the enormous capture cross section of Gd, which then emits easily detectable γ-ray cascades of about 8 MeV total energy. In turn, the highly visible neutron captures made possible by Gd loading greatly enhance the detector’s sensitivity to low energy electron anti-neutrinos  , as their dominant interaction channel is via IBD, which yields a positron and neutron in the final state. Consequently, the Gd-loaded SK now has the potential to detect as-yet-unobserved neutrinos from different astronomical sources such as the diffuse supernova neutrino background and pre-supernova stars.
Stars with greater than 8 M⊙ and a growing iron core are in the final stages of fusion shortly before core collapse; these are commonly known as pre-supernova stars. Their main cooling mechanism is the production of low energy neutrinos and anti-neutrinos from thermal and weak nuclear processes. Some of these neutrinos have enough energy to exceed the IBD energy threshold, and—if the star is close enough—can therefore be detected at SK-Gd. Pre-supernova models from Odrzywolek & Heger (2010)) and Patton et al. (2017) were used to evaluate the sensitivity of SK with 0.01% Gd to pre-supernova neutrinos. For this Gd concentration, estimations showed that pre-supernova stars can be observed in SK-Gd up to an optimistic distance of 600 pc away from Earth.
The emission of neutrinos from pre-supernova stars occurs for hours before the core collapses, which could provide an early warning for potential supernova events. A pre-supernova alert system was developed for SK and it has been active since 2021 October 22. In the case of α-Ori (Betelgeuse) with optimistic parameters, SK would produce alerts up to 9 hr before the CCSN. Nearly 20 other nearby stars could have an early warning of their coming explosion via the detection of their pre-supernova neutrinos. Estimations showed that for future phases of SK with increased concentrations of Gd, detection ranges, and early alert times of the pre-supernova alarm would be extended.
We gratefully acknowledge the cooperation of the Kamioka Mining and Smelting Company. The SK experiment has been built and operated with funding by the Japanese Ministry of Education, Culture, Sports, Science and Technology; the U.S. Department of Energy; and the U.S. National Science Foundation. Some of us have been supported by funds from the National Research Foundation of Korea NRF-2009-0083526 (KNRC) funded by the Ministry of Science, ICT, and Future Planning and the Ministry of Education (2018R1D1A1B07049158, 2021R1I1A1A01059559); the Japan Society for the Promotion of Science; the National Natural Science Foundation of China under grants No. 11620101004; the Spanish Ministry of Science, Universities and Innovation (grant PGC2018-099388-B-I00); the Natural Sciences and Engineering Research Council (NSERC) of Canada; the Scinet and Westgrid consortia of Compute Canada; the National Science Centre (UMO-2018/30/E/ST2/00441) and the Ministry of Education and Science (DIR/WK/2017/05), Poland; the Science and Technology Facilities Council (STFC) and GridPPP, UK; the European Union’s Horizon 2020 Research and Innovation Programme under the Marie Sklodowska-Curie grant agreement no.754496, H2020-MSCA-RISE-2018 JENNIFER2 grant agreement No. 822070, and H2020-MSCA-RISE-2019 SK2HK grant agreement No. 872549.