UA-Bridge: OPC-UA to MQTT/DBs Gateway

This is a simple yet powerful app I developed to bridge data from OPC-UA data servers to MQTT brokers, Google Sheets and databases.

It allows to connect to multiple OPC-UA servers, see logs, and browse the server tree for items you may want to subscribe to. When subscribed, OPC-UA variables of any type are monitored for its value changed. When a change is detected the value is posted to all output destinations configured.

Browse OPC-UA Server

Currently it is possible to export data to SQLite and PostgreSQL databases, Google Sheets and to multiple MQTT brokers. With these 4 types of realtime data export it is easy to process, store and visualize your data using tools like Grafana, Metabase, Supabase, PowerBI etc. It is also simple to export data to MQTT compatible cloud services like Azure and AWS.

The data is exported in a structured way so it is preserved as much OPC-UA information as possible.

View data exported to MQTT broker

I have made it available on the MS Store, so it can be downloaded and installed safely on Windows computers.

It comes in two versions, Free and Pro. Both have all the same features. The only difference is that the free version is limited to 100 subscribed OPC-UA variables.

Links to the app in the MS Store:

UA-Bridge Free Editionhttps://apps.microsoft.com/detail/9N60SP8JCK2M
UA-Bridge Pro Editionhttps://apps.microsoft.com/detail/9PNVRKZZ1WV4

More features and platforms are coming.


Copyright © 2025 Ricardo L. Olsen. All rights reserved.

https://www.linkedin.com/in/ricardo-olsen/

https://dscsys.com/ua-bridge.html

#SCADA #IOT #IIOT #MQTT #SQLITE #OPC #OPCUA #POSTGRESQL #GATEWAY

A new open-source SCADA/IoT system

In this article, I will try to put in words the rationale for creating a brand new open-source SCADA/IoT system.

After more than ten years of experience developing and using the OSHMI open-source HMI system, I realized that it is too difficult to maintain and expand. The in-memory real-time core is monolithic, difficult to understand. Any change can affect multiple things. OSHMI is just HMI software, it is not a full SCADA system. To expand its capabilities to support more advanced functionality would be too difficult.

It is also quite clear nowadays that traditional SCADA systems cannot deal well with the new requirements of Industry 4.0, IIoT, Big Data, IA/ML, cloud, cybersecurity, etc. When I say traditional, I mean traditional architecture and a traditional commercial business model. Many software packages are provided by big companies that just do not have the necessary agility and courage to abandon old software and start from scratch. Other smaller providers can do a better job, but the commercial model is too restrictive. Commercial software is not modifiable, is not transparent, is not agile enough. Even political motives can be a hindrance in some countries for closed source software packages.

Hopefully, there are some promising options in the open-source SCADA/IoT ecosystem, like SCADA-LTS and EdgeX Foundry.

However, open-source standalone tools like PostgreSQL/TimescaleDB, Grafana, MongoDB, Nginx, InfluxDB, and protocol stacks like OpenDNP3, lib60870, lib6150 are of such high quality that it is difficult to match for any proprietary software tool. Why not take advantage of this?

I think an adequate approach can be to create a new system by combining the best available open-source tools, not reinventing the wheel. Just use the right tool for each job.

A new innovative architecture was designed, using MongoDB as the real-time database and persistence layer. This decision has simplified the development by an order of magnitude. It allows for effortless portability, high availability, and horizontal scalability. It also brings powerful capabilities and tools, integration with many programming languages, and a healthy community for support.

With this strategy, in less than one year, it was possible to develop a new system from scratch. JSON-SCADA was already deployed successfully for local substation HMI. For control centers, it requires some more work, but it is to be put on production in just a few months.

The foundations of JSON-SCADA are strong and future-proof. The system should grow fast from now on in terms of capabilities and the completion of its protocol suite.

If you think this is meaningful, please check the project repository here

https://github.com/riclolsen/json-scada

Contributions are always welcome in any form, like help with translation, testing, coding, feature ideas, etc.


Copyright © 2020 Ricardo L. Olsen. All rights reserved.

https://www.linkedin.com/in/ricardo-olsen/

#SCADA #IOT #IIOT #OPENSOURCE #HMI #MONGODB

Creating SCADA-Like User Interfaces For Node-RED

Node-RED is a popular flow-based programming tool that has powerful IoT capabilities. With this framework, you can visually wire together protocol nodes, like MQTT and Modbus, data manipulation processing nodes, and output nodes like dashboards and user interfaces, creating the so-called “flows”.

Node-RED makes it easy to create dashboard interfaces as it is using the node-red-dashboard node.

dashboarde
Node-RED Dashboard – Source nodered.org

But what about SCADA-like graphics that mimic processes like the one below?

interfaz_hmi
SCADA mimic graphic. Source commons.wikimedia.org.

Now, this is possible in an efficient manner using the SCADAvis.io HTML5 Synoptic Toolkit combined with the node-red-contrib-uibuilder” package.

The UIbuilder package provides an easy way to create Node-RED user interfaces using web front-end frameworks.

SCADAvis.io is an HTML5 toolkit that makes it easy to create SCADA-like synoptic graphics to be embedded in webpages code. It is based on SVG vector graphics created using an Inkscape customized editor. This editor allows for the markup of the SVG graphical objects with data-linked animations. Graphical properties like fill/stroke color, text, size, opacity, rotation, position, etc., can be tied to tagged data values for the creation of the SCADA-like graphics. Look at SCADAvis.io site for examples and documentation.

Next, I present a step-by-step example of creating a substation user interface for Node-RED.

Steps to create a UI for Node-RED using SCADAvis.io

1. Add the UI-Builder Package.

  • Add the “node-red-contrib-uibuilder” package to Node-RED. See documentation for UI-Builder here.
  • Add the uibuilder node to the flow.

2. Edit the UI-Builder source files.

3. Insert an Inject node in the flow.

4. Deploy and Open UI.

Screenshot from 2019-09-29 16-14-30
Interactive substation user interface with debug messages from UI Builder.

5. Develop your own displays.

  • Customize the code in index.html and use the SCADAvis.io Synoptic Editor to create new displays.
  • Process events generated in the interface and output to other nodes as needed. Customize the .on(click“) event of the SCADAvis API (line 74 in the example index.html).


Copyright © 2019 Ricardo L. Olsen. All rights reserved.

SCADAvis.io HTML5 Synoptic Toolkit, free plugins for Power BI and Grafana.

DSC Systems – https://dscsys.com

#NODERED #NODE-RED #SCADA #HMI #SYNOPTIC #MIMIC #GRAPHICS

Connecting Power BI to SCADA/OPC Data Sources

This article presents a simple (and free) way to obtain SCADA/OPC data inside MS Power BI.

The OPC2PowerBI tool can be used to connect to OPC UA and/or DA data sources, it can read periodically or subscribe to OPC tags. This tool makes all gathered data available to MS Power BI through the OData Feed data source connection.

Download the tool from here https://github.com/riclolsen/OPC2PowerBI/releases .

OPC connections are configured in a text file (opc2powerbi.conf).

#port, service_name (for the OData HTTP server)
8080, odata

# OPC SERVERS

#  OPC_UA_URL,                   READ_INTERVAL_IN_SECONDS,  SERVER_NAME
opc.tcp://opcuaserver.com:48484, 10,                        Server1

# OPC TAGS TO READ FROM THE SERVER

# OPC_TAG_PATH                        ,TYPE      ,SUBSCRIBE ,TAG(must be unique)
ns=1;s=Countries.US.Queens.Latitude   ,Double    ,Y         ,US.Queens.Latitude                
ns=1;s=Countries.US.Queens.Longitude  ,Double    ,N         ,US.Queens.Longitude    

# ... repeat for more servers

After configuring OPC servers and tags, test the connection executing the OPC2PowerBI.exe file. Look for the log messages to see if it is all ok. Type errors for tag values can generate exceptions in the code. Be sure to specify the correct types for tags in the config file.

OData version 4.0 provides a simple JSON based data format and also a metadata definition mechanism. Power BI can connect easily to OData sources, making the collected data available as tables.

After the tool is collecting OPC data with no errors, create a new OData Feed data source in PowerBI Desktop and type http://127.0.0.1:8080/odata in the URL field. A new data table will be created. All the columns types are automatically detected.

The data table contains the following columns:

  • Tag (type text) as defined in the TAG field of opc2powerbi.conf.
  • DoubleValue (type decimal number), value as a floating point number.
  • BoolValue (type true/false), value as a logic state.
  • StringValue (type text), the value as a string.
  • Quality (type text), quality of data can be “Good” or “Bad” or “None”.
  • ServerTimestamp (type date/time), time the data was collected by the OPC server.
  • SourceTimestamp (type date/time), time stamp from the data source.

OPC can provide data in many formats like Boolean, Double, Int16, Byte, String, etc. All supported formats are converted as meaningfully as possible to the Double, Bool and String columns of the Power BI table. The user must choose how to use the fields appropriately.

Data must be refreshed manually using the Power BI Desktop “Refresh” button. Possibly, in an upcoming version of Power BI Desktop, it will be possible to refresh the data periodically (Direct Query currently is not supported for OData data sources).

See my other article to know how to create SCADA-like synoptic graphics in Power BI.

https://ricolsen1supervc.wordpress.com/2019/05/12/scada-like-graphics-in-power-bi/

SCADAvis.io Synoptic Visual at Microsoft AppSource.

SCADAvis.io/powerbi Synoptic Visual page.

OPC to Power BI Data Bridge.


Copyright © 2019 Ricardo L. Olsen. All rights reserved.

SCADAvis.io HTML5 Synoptic Toolkit, free plugins for Power BI and Grafana.

DSC Systems – https://dscsys.com

#SCADA #OPC #POWERBI #HMI #SYNOPTIC #MIMIC #GRAPHICS

SCADA-Like Graphics in Power BI

screenshot1
SCADAvis Synoptic Visual in action in Power BI.

MS Power BI is an amazing platform, it is an extremely well-conceived product, both technically and from a business standpoint. A product that I believe is the pinnacle that can be crafted by a great software company with decades of experience in development: the now revamped Microsoft. It is incredible how easy it is to gather data from many sources, transform, filter and create interactive graphics in Power BI.

One of the major and unique features of the Power BI platform in relation to other BI products is the ability for the community of programmers to contribute with custom visuals. There are a plethora of custom visuals available for the most diverse use cases. Those custom visual are created with standard web-based languages like HTML, CSS, Javascript, and Typescript. The custom visuals are tested by Microsoft Power BI experts, cataloged and made available online for download at Microsoft AppSource.

There is one type of graphics that was missing though: SCADA-like graphics, a.k.a. synoptic graphics. Those are custom-drawn, free-form graphics, that can mimic real-world processes like manufacturing processes, chemical processes, and power systems.

Now, the graphics capabilities of a real SCADA are finally available inside Power BI through the SCADAvis.io Synoptic Visual.

Using an SVG graphics editor (based on Inkscape), it is possible to create graphics linked to tags (measurements identifiers) that will trigger animations of graphical properties like size, position, text, color and transparency when bound to Power BI data.

screenshot3
SCADAvis Synoptic Editor.

Access the pages below to see the example video, embedded demo, and download a “.pbix” demo file.

Microsoft’s official Power BI blog post.

SCADAvis.io Synoptic Visual at Microsoft AppSource.

SCADAvis.io/powerbi Synoptic Visual page.

OPC to Power BI Data Bridge.


See also my other article about how to obtain SCADA/OPC data in Power BI

https://ricolsen1supervc.wordpress.com/2019/06/16/connecting-power-bi-to-scada-opc-data-sources/


Copyright © 2019 Ricardo L. Olsen. All rights reserved.

SCADAvis.io HTML5 Synoptic Toolkit, free plugins for Power BI and Grafana.

DSC Systems – https://dscsys.com

#SCADA #POWERBI #HMI #SYNOPTIC #MIMIC #GRAPHICS #OPC

Supervision and Control of IoT devices With OSHMI

louis-reed-747404-unsplash

The Open Substation HMI (OSHMI) is perfect for the task of gathering data from and enabling the control of IoT devices (and other types of devices and systems also):

  • It is free and Open Source.
  • It is modular, powerful, easy to use and to adapt to any task.
  • It does have a vector graphics web interface that is mobile and cloud-friendly.
  • There are plenty of integrated tools readily available (PostgreSQL, Grafana, MongoDB, PowerBI, Tableau, etc.).

There are some common protocol drivers available in OSHMI such as OPC, Modbus, and DNP3 that are used by many types of devices.

OSHMI also provides a very simple JSON UDP interface that makes it extremely easy and inexpensive to feed real-time data and receive controls from it.

So, it is possible for any hobbyist or device maker, using almost any programming language, with little modification in the device or system code they have access, to send data in real-time to OSHMI for synoptic display, historical recording, and receiving control.

A simple UDP message as below is used to convey data from the device to OSHMI:

[ { "tag": "DEV1-MEAS-1", "value": 123.45 }, 
  { "tag": "DEV1-MEAS-2", "value": 678.3 }, 
  { "tag": "DEV1-STAT-1", "value": true } ]

This message will update values for the three points in OSHMI identified by the specified tags. The message is easy to build and send, with just string concatenation and a call to send a UDP data buffer.

When the user of OSHMI chooses to control some value or state, a UDP message like below is sent from OSHMI to the device:

{ "tag": "DEV1-OUTPUT-1", 
  "rtu": 1, 
  "value": 0, 
  "logic_val": false, 
  "action": "Turn_Off" }

The receiver device should parse the message to interpret the action to be taken. Most programming languages have built-in JSON parsers or do have some library available that makes it easy to parse JSON messages.

As an example of interfacing with OSHMI using JSON UDP messages, I present here some simple VB code that can be run in Windows Powershell.

Sending UDP messages:

' From https://gist.github.com/PeteGoo/21a5ab7636786670e47c
function Send-UdpDatagram
{
Param ([string] $EndPoint, 
[int] $Port, 
[string] $Message)

$IP = [System.Net.Dns]::GetHostAddresses($EndPoint) 
$Address = [System.Net.IPAddress]::Parse($IP) 
$EndPoints = New-Object System.Net.IPEndPoint($Address, $Port) 
$Socket = New-Object System.Net.Sockets.UDPClient 
$EncodedText = [Text.Encoding]::ASCII.GetBytes($Message) 
$SendMessage = $Socket.Send($EncodedText, $EncodedText.Length, $EndPoints) 
$Socket.Close() 
} 
Send-UdpDatagram -EndPoint "127.0.0.1" -Port 9100 -Message '[{"tag": "DEV1-MEAS-1", "value": 123.45}]'

To receive and display OSHMI command UDP messages:

' From https://github.com/sperner/PowerShell/blob/master/UdpServer.ps1
param( $address="Any", $port=9101 )
try{
$endpoint = new-object System.Net.IPEndPoint( [IPAddress]::$address, $port )
$udpclient = new-object System.Net.Sockets.UdpClient $port
}
catch{
throw $_
exit -1
}
Write-Host "Press ESC to stop the udp server ..." -fore yellow
Write-Host ""
while( $true )
{
if( $host.ui.RawUi.KeyAvailable )
{
$key = $host.ui.RawUI.ReadKey( "NoEcho,IncludeKeyUp,IncludeKeyDown" )
if( $key.VirtualKeyCode -eq 27 )
{ break }
}
if( $udpclient.Available )
{
$content = $udpclient.Receive( [ref]$endpoint )
Write-Host "$($endpoint.Address.IPAddressToString):$($endpoint.Port) $([Text.Encoding]::ASCII.GetString($content))"
}
}
$udpclient.Close( )

To consult the complete specification of this interface, see the “JSON Protocol Driver Interface” section from the OSHMI Configuration Manual.


*Article Update: Now it is also possible to use OPC UA/DA to connect devices directly to OSHMI, making it an even better solution for an IoT HMI platform.

OSHMI is available at https://sourceforge.net/projects/oshmiopensubstationhmi/.


Copyright © 2018-2019 Ricardo L. Olsen. All rights reserved.

Company: DSC Systems – https://dscsys.com

SCADAvis.io HTML5 Synoptic Toolkit, free plugins for Power BI and Grafana.

XPlain SCADA@cloud SCADA as-a-service.

For free assistance on OSHMI, professional support, managed cloud hosted SCADA service, partnerships, or customization of applications for device manufacturers, please contact me on LinkedIn https://www.linkedin.com/in/ricardo-olsen/.

#SCADA #IoT #PROTOCOLS #MODBUS #DNP3 #SYNOPTIC #HMI #OSHMI #OPC #JSON


Usando OSHMI – Parte 1: Casos de Uso Común

oshmi

La HMI para subestación abierta (OSHMI) es una HMI basada en HTML5 basada en código abierto y moderna concebida desde cero para el funcionamiento de subestaciones, aunque puede utilizarse con seguridad en cualquier otro campo de automatización, como el industrial, la edificación, IoT, etc.

En esta serie de artículos, cubriré muchos aspectos del uso del software: la instalación, la configuración de bases de datos de puntos y protocolos, la creación de gráficos, scripting, etc. Empecemos con algunos casos de uso común para el sistema.

La filosofía rectora del proyecto es mantener las cosas lo más sencillas posibles mediante la integración de herramientas de código abierto ya establecidas como Nginx, PHP, Lua, SQLite, Chromium, Inkscape, etc. El uso de estándares y tecnologías web es también una prioridad: SVG, Javascript, JSON, HTTP, OData, D3JS, Vega, etc. Esto le da al proyecto un claro camino de mejora por el desarrollo continuo de las tecnologías subyacentes, además de mantener el desarrollo a un nivel más alto sobre todas estas herramientas. Además, el uso de estándares abiertos permite una fácil integración con otros sistemas y herramientas.

OSHMI es lo suficientemente modular y flexible como para poder ser utilizado de muchas maneras diferentes. El sistema se compone de tres módulos que pueden ser separados o unidos a voluntad:

  • El controlador de protocolo
    El servidor web en tiempo real
    Interfaz de usuario cliente

untitled_page
Arquitectura modular OSHMI

Por ejemplo, para el control de subestaciones locales, es posible utilizar un solo PC con los tres módulos integrados. Para una aplicación de Centro de Control, puede utilizar 2 servidores redundantes con el controlador de protocolo y módulos de servidor web en tiempo real, y tantos PCs cliente como sea necesario con sólo la parte de interfaz de usuario. También es posible tener el controlador de protocolo junto al proceso controlado, el servidor web en tiempo real en la nube y la interfaz cliente en un dispositivo móvil (teléfono, tableta, etc.). Aprendiendo a configurar y combinar estos módulos se pueden cubrir muchos casos de uso, teniendo en cuenta el costo y rendimiento de los dispositivos cliente y servidor, requisitos de seguridad, características de ancho de banda y canal de comunicación, ubicaciones para la operación, etc.

local_command
Una sola máquina con todos los módulos OSHMI

control_center
Arquitectura del Centro de Control OSHMI

For an IoT scenario, it is possible to use a protocol converter, if necessary to cover all the needed protocols, and hosting all the system in the cloud to be accessed securely from anywhere.

Para un escenario IOT, es posible utilizar un convertidor de protocolo, si es necesario para cubrir todos los protocolos necesarios, y alojar todo el sistema en la nube a la que se puede acceder de forma segura desde cualquier lugar.

El uso del servidor HTTP de Nginx facilita la seguridad de las comunicaciones cliente/servidor mediante la posibilidad de utilizar HTTPS, autenticación de usuario y certificados de cliente. Otros servidores web como Apache se pueden personalizar y el módulo de servidor web en tiempo real puede ejecutarse también en un sistema operativo Linux si se desea.

El backend de la base de datos incrustada está basado en SQLite, pero es posible con algunos scripts para reenviar datos históricos a un MySQL, MS SQL Server, PostgreSQL, InfluxDB, u otro SGBD para un backend más robusto si es necesario para almacenar grandes cantidades de datos (más de 20GB) o cuando habrá muchos clientes accediendo a datos históricos simultáneamente (más de 10).

En resumen, el sistema OSHMI permite una gran flexibilidad y personalización. La característica de código abierto, el uso de estándares web y los subsistemas generalmente disponibles permiten casi cualquier tipo de personalización necesaria para cubrir muchos casos de uso de manera efectiva y al mismo tiempo minimiza los costos.

OSHMI está disponible en: https://sourceforge.net/projects/oshmiopensubstationhmi/.


Copyright © 2017 Ricardo L. Olsen. Todos los derechos reservados..

Empresa: DSC Systems – https://dscsys.com

SCADAvis.io HTML5 Synoptic Toolkit.

Servicio XPlain SCADA@cloud.

Para obtener asistencia gratuita sobre OSHMI, soporte profesional, servicio gestionado SCADA alojado en la nube, asociaciones o personalización de aplicaciones para los fabricantes de dispositivos, por favor póngase en contacto conmigo en LinkedIn https://www.linkedin.com/in/ricardo-olsen/.

#SCADA #PROTOCOLS #IEC61850 #IEC60870 #DNP3 #OPEN #SOURCE #HMI #ICCP


==> Part 2 – Installation

Using OSHMI – Part 2: Installation

The purpose of this article is to help to understand the requirements and the installation process of OSHMI.

System Requirements And Tuning

The hardware requirements will depend on the size and architecture of the system.

For a small system like a single substation up to 3000 tags, a cheap machine can take care of the load.

Recommended minimum hardware for most use cases:

Intel Core I5 or AMD Ryzen 5 processor, 4GB of RAM, 250GB HD, 4k capable GPU, 27″ UHD monitor, Windows 10.

For sure it is possible to use a less capable system, but this possibly will require some additional tuning and testing. For example a server only machine can have only 2GB of RAM and a slower processor (e.g. Intel Atom), this can enable the use of a fan-less rugged hardware.

For Control Centers typically processing 50k tags or more, it is recommended a more capable hardware:

Intel Core I7/AMD Ryzen 7 processor with 4 nuclei or better processor, 16GB of RAM, 512GB SSD,  4k capable GPU, 27″ or greater UHD monitor, gigabit ethernet, Windows 10.

It is possible to use also older versions of Windows. I recommend Windows 10 because it manages UHD 4k monitors in a much better way than the older versions. Even Windows XP can be used but in this case, it is necessary to use an older version of the Chromium browser, 49 is the last version compatible with Windows XP (‘chromium_browser_for_win_xp.zip’ package in the OSHMI Sourceforge Files section).

Some Windows tuning sometimes helps a great deal in the performance and responsiveness of the system. Some simple measures that can help (try them one at a time until you reach good performance):

  • Uninstall all the manufacturer bloatware and other unessential software.
  • Disable all energy economy functions, put the system in the maximum performance option.
  • Do not enable screensavers.
  • Remove unessential startup items (using MSConfig).
  • Disable Windows 10 Apps background processing.
  • Disable all Windows privacy options.
  • Disable automatic updates.
  • Remove unnecessary Windows features (as Vista Gadgets, tablet extensions, etc.).
  • Disable Windows UAC.
  • Disable some Windows Services such as Ready Boost, Super Fetch, and Windows Search.
  • Disable Windows Firewall.
  • Do not use third-party antivirus, prefer Windows embedded protection tools.
  • Disable Windows real-time and cloud-based protection.

For mobile clients, it is necessary only a modern HTML5 browser like Chrome, Firefox, Opera or Safari. The performance of SVG Screens can be bad for old or underpowered devices. In general, an intermediary priced current device can handle SVG processing with good performance. Very complex screens with many objects and animations may require a top performant device like expensive flagship phones or tablets.

Installation

As stated in the previous article, OSHMI aggregates various open-source projects in a single easy to install package. All the system is pre-configured with reasonable defaults and the required intervention in the configuration files is kept to a minimum.

To install OSHMI first download the latest version from the main repository https://sourceforge.net/projects/oshmiopensubstationhmi/. Execute the installer oshmi_setup_xxx.exe as an administrator user. The system will install to c:\oshmi.

After the setup ends go to c:\oshmi\extprogs and run download_external_progs.bat, this will install some optional utilities and the screen editor Inkscape+SAGE.

The install and updates cycle is designed not to overwrite configuration, database and screen files. So when a new version is installed all the current state of the system is expected to be preserved. None the less I recommend a backup before installing a new version (especially for the conf, svg, charts and scripts folders).

The more important folders under the c:\oshmi are (see the complete list in the configuration manual):

  • bin – executable files
  • conf – configuration files
  • db – database files
  • docs – documentation
  • htdocs – HTML5 files
  • svg – display screen files
  • nginx_php – web server and scripting engines

The setup program creates an OSHMI folder on the desktop. This folder contains shortcuts to many system files and functions. To quickly test the installed system, execute the “_Start_OSHMI” shortcut. This will execute the server subsystem and open the Screen and Alarms Viewers. The system is preconfigured to run a simulation with an example point list and screens. To simulate a command, click on a breaker and push the “Command” button then choose an action like “OPEN” or “CLOSE” and push the action button. To stop the system click on the “Stop_All” icon in the OSHMI folder. To edit and create new SVG screens use the Inkscape+SAGE editor.

By default, the system is configured to allow only HTTP access to the local machine (localhost, 127.0.0.1). To allow external access, edit the “c:\oshmi\conf\nginx_access_control.conf” file to add the desired IP addresses. You can do this to test access on tablets or cell phones. To open the Screen Viewer on a remote device, enter the URL http://w.x.y.z:51909/htdocs/screen.html (replace w.x.y.z by the server IP address) in a compatible browser (Chrome, Firefox, Safari or Opera). It is possible to change the HTTP port, enable HTTPS, add client certificates and enable user auth by tampering with the Nginx configuration.

That’s it: following these simple instructions you should easily have a running system. The next step is to learn how to configure the system: a matter for the next articles.


OSHMI is available at https://sourceforge.net/projects/oshmiopensubstationhmi/.


Copyright © 2017 Ricardo L. Olsen. All rights reserved.

Company: DSC Systems – https://dscsys.com

SCADAvis.io HTML5 Synoptic Toolkit.

XPlain SCADA@cloud service.

For free assistance on OSHMI, professional support, managed cloud hosted SCADA service, partnerships, or customization of applications for device manufacturers, please contact me on LinkedIn https://www.linkedin.com/in/ricardo-olsen/.

#SCADA #PROTOCOLS #IEC61850 #IEC60870 #DNP3 #OPEN #SOURCE #HMI #ICCP


==> Part 1 – Use Cases

Using OSHMI – Part 1: Common Use Cases

oshmi

The Open Substation HMI (OSHMI) is a modern open-source HTML5 based HMI conceived from the ground up for substation operation, even though it can for sure be used in any other automation field such as industrial, building, IoT, etc.

In this series of articles, I will cover many aspects of the usage of the software: the installation, the configuration of point databases and protocols, the creation of graphics, scripting, etc. Let’s begin with some common use cases for the system.

The guiding philosophy of the project is to keep things as simple as possible by the means of integrating ready made established open source tools such as Nginx, PHP, Lua, SQLite, Chromium, Inkscape, etc. The use of web standards and technologies is also a priority: SVG, Javascript, JSON, HTTP, OData, D3JS, Vega, etc. This gives the project a clear path of improvement by the continuous development of the underlying technologies, also it maintains the development at a higher level on top of all these tools. Additionally, the use of open standards allows for an easy integration with other systems and tools.

OSHMI is modular and flexible enough that it can be used in many different ways. The system is composed of three modules that can be separated or joined as desired:

  • The protocol driver
  • The real-time web server
  • The client user interface

untitled_page
OSHMI Modular Architecture

For example, for local substation control, it is possible to use a single PC with all three modules integrated. For a Control Center application, you can use 2 redundant servers with the protocol driver and real-time web server modules, and as many client PCs as needed with just the user interface part. It is also possible to have the protocol driver next to the controlled process, the real-time web server on the cloud and the client interface on a mobile device (phone, tablet, etc.). Learning to configure and combine these modules you can cover many use cases, taking into consideration cost and performance of server and client devices, security requirements, bandwidth and communication channel characteristics, locations for operation, etc.


local_command
A single machine with all OSHMI modules

control_center
OSHMI Control Center Architecture

For an IoT scenario, it is possible to use a protocol converter, if necessary to cover all the needed protocols, and hosting all the system in the cloud to be accessed securely from anywhere.

The use of the Nginx HTTP server makes it simple to secure client/server communications by the possibility of using HTTPS, user authentication, and client certificates. Other web servers as Apache can be customized and the real-time web server module can run also on a Linux OS if desired.

The embedded database backend is SQLite based, but it is possible with some scripting to forward historical data to a MySQL, MS SQL Server, PostgreSQL, InfluxDB, or other SGBD for a more robust backend if necessary to store big quantities of data (more than 20GB) or when there will be many clients accessing historical data simultaneously (more than 10).

In short, the OSHMI system allows for a great deal of flexibility and customization. The open source characteristic, the use of web standards and the generally available subsystems permit almost any type of customization necessary to cover many use cases effectively and at the same time minimizes costs.

OSHMI is available at: https://sourceforge.net/projects/oshmiopensubstationhmi/.


Copyright © 2017 Ricardo L. Olsen. All rights reserved.

Company: DSC Systems – https://dscsys.com

SCADAvis.io HTML5 Synoptic Toolkit, free plugins for Power BI and Granfana.

XPlain SCADA@cloud service.

For free assistance on OSHMI, professional support, managed cloud hosted SCADA service, partnerships, or customization of applications for device manufacturers, please contact me on LinkedIn https://www.linkedin.com/in/ricardo-olsen/.

#SCADA #PROTOCOLS #IEC61850 #IEC60870 #DNP3 #OPEN #SOURCE #HMI #ICCP


==> Part 2 – Installation

Free Tools for Testing Communication Protocols

It is a regular task for those who work with automation systems, SCADA, etc., to configure the data exchanges between the devices, using communication protocols.

Often, these integrations between client and server devices are not easily obtainable. When a problem occurs, there is always a question of whether the cause is on the client or the server. In these cases, you can use third-party tools to simulate client and server systems, log communications so you can better analyze the problem.

In this article, I present some useful tools to perform tests and simulations of some communication protocols. There are many commercial tools for this purpose in the market, like ASE 2000 and Triangle Test Harness, but I will focus only on those that can be obtained free of charge and allow continued use without that typical 30-day limit of use.

Opendnp3 Simulator

2017-06-25 (2)

This tool is part of the Opendnp3 project, a pretty complete and excellent quality open source DNP3 protocol implementation.

The simulator allows you to do both the client and server roles. Protocol or TCP variants can be configured. You can create multiple devices. Quality values and bits can be edited for the generation of events in the protocol.

The logs produced are quite detailed and easy to understand, presenting separately the levels of binding, transport, and application.

To download this simulator here:

https://github.com/riclolsen/dnp3-simulator/releases/download/v0.0.1/dnp3-simulator-setup.msi

IEC Server

1

This software simulates an IEC60870-5-104 protocol server.

You can add point by point to be made available by configuring information type, ASDU address, transmission cause, object address, and value. Timed simulation of values can be made or can be changed manually. The point database can be saved and reloaded later.

It is available at: https://sourceforge.net/projects/iecserver/.

QTester104

1 (1)

This open source tool, developed by myself as a part of the open source SCADA project OSHMI (Open Substation HMI), allows to play the role of the client of protocol IEC60870-5-104, that is, it obtains data from a server.

The capabilities of the tool are:

  • Acquisition of various types of information (ASDU’s).
  • Sending digital and analog commands of various types.
  • Sending General Interrogation (GI) request.
  • Sending time synchronization.
  • Log of the protocol in a readable format that can be copied.
  • Exportable table with all acquired points, values, qualifiers, type of ASDU, cause, time tag, etc.
  • TLS Connections

Available here: http://qtester104.sourceforge.net/.
Or here: http://github.com/riclolsen/qtester104.

MZ Automation IEC 60870-5-101/104 Test Tool

2020-05-17 (1)

This is a free version of a pro-tool that has some restrictions but it is very useful anyway. The 101 protocol is not available in the free version, however.

It works as a client and has a very complete implementation of the 101/104 protocols producing a detailed and easy to read overview of protocol events, raw log and object viewer.

This tool is created with their 101/104 GPL protocol implementation that is fantastic, highly recommended also.

Download here https://www.mz-automation.de/communication-protocols/iec-60870-5-104-test-tool/.

Vincy Software

vinci soft

This software is a companion to an interesting device that has various ports (USB, RS-232, RS485, fiber) and adapters. The software, however, can be also used without the device.

Supported protocols are Modbus TCP/RTU/ASC and IEC 60870-101/103/104, in slave and master modes. Project files can be saved and point lists can be exported as text files.

A unique feature is that it is possible to attribute pin functions individually for serial ports.

Software available here http://the-vinci.com/vinci-software/.

OPC Watch

0

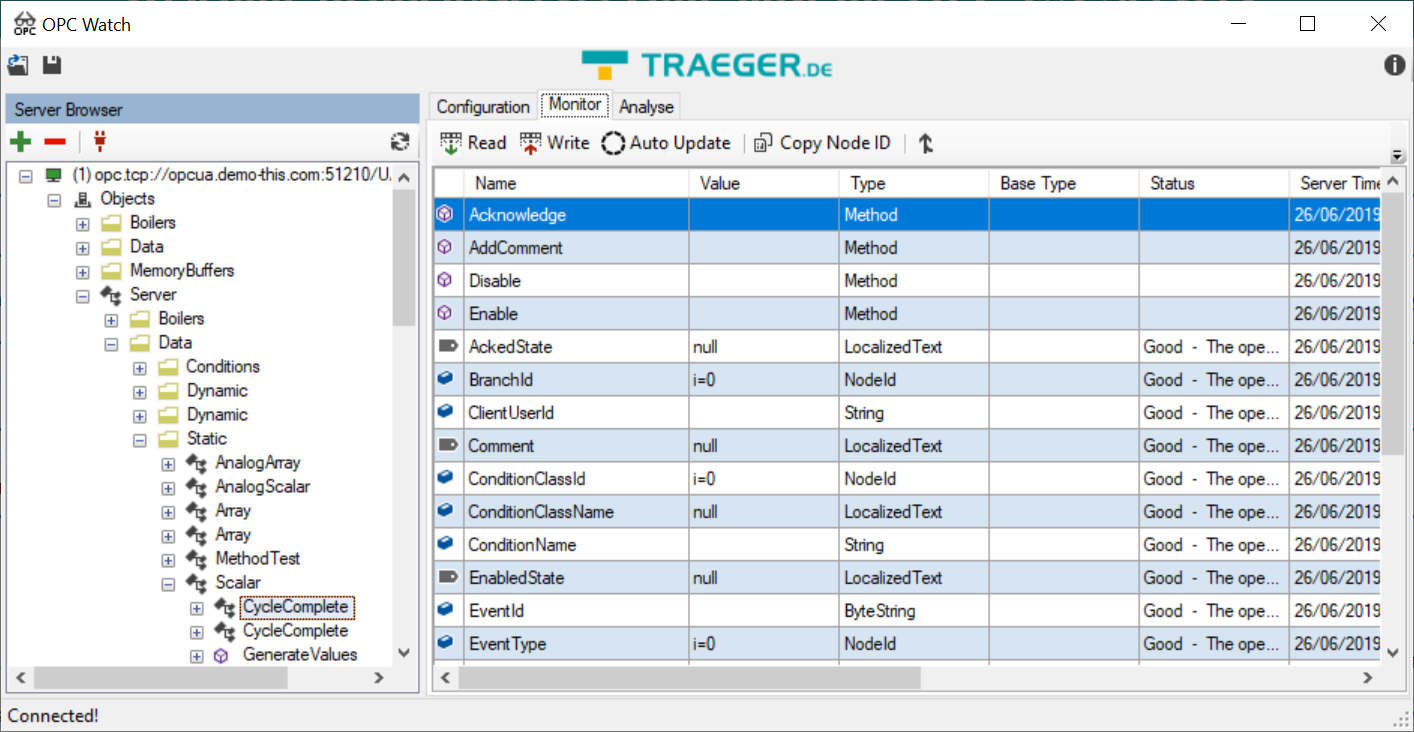
This tool allows to connect to OPC UA servers and explore its nodes in detail. Connections can be established also with certificates and authentication.

It is possible to auto-update values, write values to nodes, save project files and export node identifiers.

Available here (no registration required) https://www.traeger.de/opc-produkte/net-opc-ua-server-and-client-sdk.html.

Modbus PLC Simulator

2017-06-25 (5)

Modbus open source slave simulator.

Allows entering the simulated data manually, by automatic animation or through VB script. Performs message logging. Import CSV file settings.

Link to download: http://www.plcsimulator.org/downloads.

UnSlave Modbus Slave Simulator

This is a powerful slave simulator that works in console mode. It can be configured to create multiple slaves and respective available data using a JSON config file. This an HTTP API that allows to simulate values. This too is very useful to create a big number of slaves for testing Modbus masters.

Link to download: https://unserver.xyz/products/modbus-slave-simulator/

ModbusExaminer

read_main

This is an open source Modbus client that can read and write to slave devices.

The software can be downloaded from here: http://www.minaandrawos.com/tcp-modbus-examiner-tool/.

IED Explorer

iedexp

This is a great open source tool to test IEC61850 devices.

It can inspect and write variables values in the tree structure of IEC61850, send commands, download files and also capture MMS and Goose packets.

Available here: https://sourceforge.net/projects/iedexplorer/.

Axon Test

tes2

This tool allows you to simulate several protocols in master and slave mode: Modbus DNP3, IEC 60870-101/103/104.

In freeware mode, you can only simulate one device at a time and you can not save the settings. Still, the tool is extremely useful.

The quality of the logs is very good. You can configure automatic value simulations, give feedback to commands in state points, generate events, etc.

To obtain it is necessary to register in the site:http://www.axongroup.com.co/downloads/.

Enilit CMS

Enilitcms-sshot.png

Last but not least, Enilit CMS is a complete protocol gateway software. This is without a doubt the best and most powerful free protocol testing tool available. The only limitation of the demonstration version is that after 12h of continuous use the gateway stops to distribute data, needing to be restarted to resume distribution.

Easy to use, Enilit CMS allows you to add, without limits, master and slave ports for the available protocols. The data acquired by one protocol can be distributed by others, combined as desired.

The slave protocols are IEC60870-5-101 / 104, DNP3 Serial and SPA-Bus. The master protocols are IEC61850, IEC60870-5-101 / 103 / 104, DNP3 Serial / TCP, Modbus Serial / TCP and SPA-Bus. Data simulators are also available.

All settings can be changed online, without restarting the system.

The quality of the implementation of the protocols is excellent, with international certifications. The logs are very complete and detailed.

To obtain a download link of this software, request it here:

http://www.enilit.lt/index.php?page=downloads


Copyright © 2017-2025 Ricardo L. Olsen. All rights reserved.

SCADAvis.io HTML5 Synoptic Toolkit, SCADA-like graphics for the Web, Power BI, NodeRed and Grafana.

Company: DSC Systems – https://dscsys.com

#SCADA #PROTOCOLS #IEC61850 #IEC60870 #DNP3 #OPEN #SOURCE